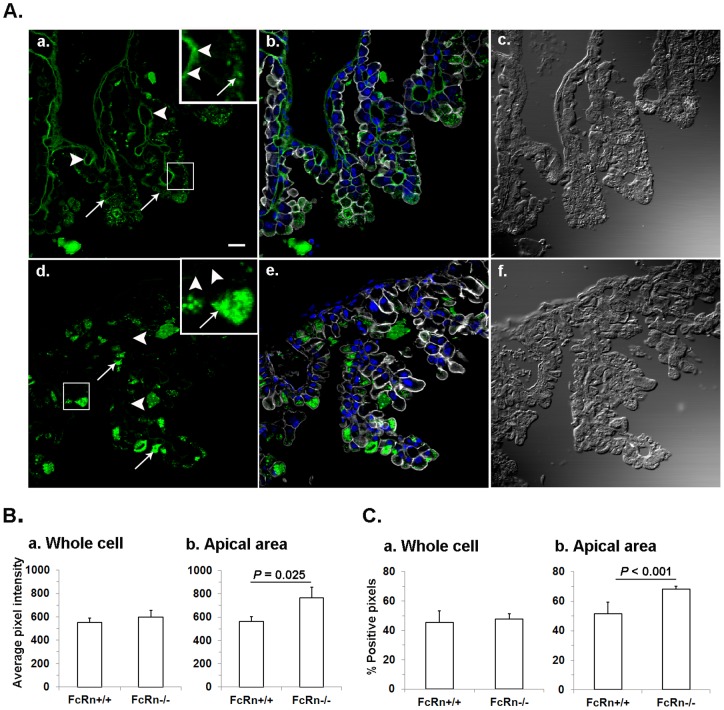
Figure 6. Comparison of distribution of IgG between FcRn+/+ and FcRn−/− YS endoderm.
A. Photomicrographs illustrating YS sections from FcRn+/+ (a, b, c) and FcRn−/− (d, e, f) YS labeled to visualize IgG (green) as was done in Fig. 5. The phalloidin (gray) and DAPI (blue) labeling were used to mark cell boundaries and nucleus, respectively, shown in b and e. For orientation DIC images in c and f are shown. The solid arrows and arrow heads point to IgG in apical endoderm and mesenchyme, respectively. The bar = 10 µm. The inset of a and b, containing a higher magnified view of an outlined area of FcRn+/+ and FcRn−/− yolk sac are shown. The solid arrows and arrow heads, respectively, point to IgG in apical and in mesenchyme areas in FcRn+/+. The lack of IgG in FcRn−/− mesenchyme and the presence of dense blobs in apical areas are shown by arrow heads and solid arrows respectively. B. Quantitative comparison of IgG (average intensity) between FcRn+/+ and FcRn−/− in whole cell and apical areas of ED. Fluorescence images such as shown in panel A (a and c) were collected on a confocal microscope. The images were quantified, averaged for 300 cells, and plotted as average intensity for each strain (n = 3 FcRn+/+ or 3 FcRn−/− mice). a. The image shows that total IgG in FcRn−/− is slightly higher but not statistically different than FcRn+/+ (P = 0.681). b. The image shows that IgG is more intense in FcRn−/−apical areas than in FcRn+/+. C. Number of pixels positive for IgG signal was quantified. Fluorescent images were converted to binary images and then used for quantifying the percent positive pixels. a. A difference could not be found in the percent of pixels positive for IgG in whole cell of FcRn+/+ and FcRn−/− were almost equal (P = 0.554). b. Percent positive pixels in FcRn−/− apical portion was significantly higher than in FcRn+/+.

