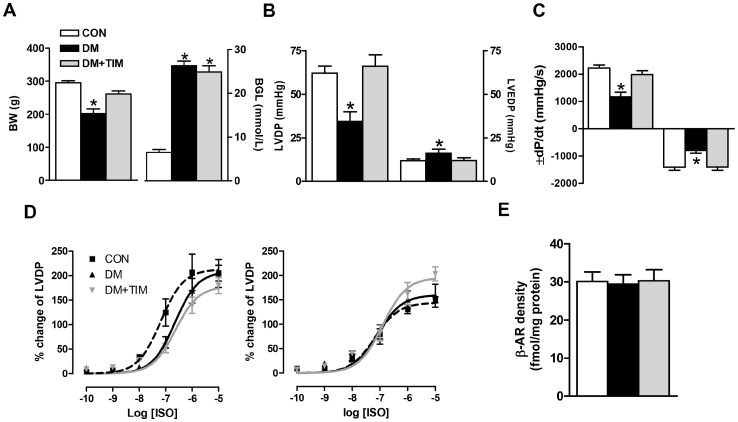
Figure 1. Timolol treatment prevents cardiac dysfunction via normalizing basal mechanical activity.
(A) Body weights (left) and blood glucose levels (right) of the rats at the end of the 12-week experimental period. Left ventricular developed pressure, LVDP (B, left) and left ventricular end diastolic pressure, LVEDP (B, right), the rates of changes in the developed pressure (±dP/dt) (C). Bar graphs in A to C represent mean ± SEM values from control, diabetic, and timolol-treated diabetic groups (number of rats in the groups; nCON = 18, nDM = 24, and nDM+TIM = 18, respectively) Effects of submaximal concentrations of a non-specific agonist, isoproterenol (ISO) on LVDP responses measured in short-term (left) and long-term (right) timolol-treated as well as untreated diabetic rats (D). Concentration–response curves for ISO represent the inotropic responses as % of their initial values and the LogEC50 value, which is equal to the concentration required to produce 50% of the maximal response induced by the agonist as determined from log-probit plots of individual response vs. concentration. LogEC50 values for ISO responses: −7.2±0.2, −6.6±0.2, −6.6±0.1 for short-term (4-week) protocol groups and −7.2±0.1, −7.1±1.2, −6.9±0.1 for long-term (12-week) protocol groups, in CON (n = 7/8 for 4-week/12-week), DM (n = 6/7 for 4-week/12-week), and DM+TIM (n = 7/7 for 4-week/12-week), respectively. The total β-AR density was measured in the crude membrane preparation from the hearts of long-term protocol groups by using saturation-binding technique with 125I-cyanopindolol (E). Bar graphs and the data points in each curve represent mean ± SEM values from CON (n = 6), DM (n = 7), DM+TIM (n = 6) groups. Significant at *p<0.05 vs. CON.

