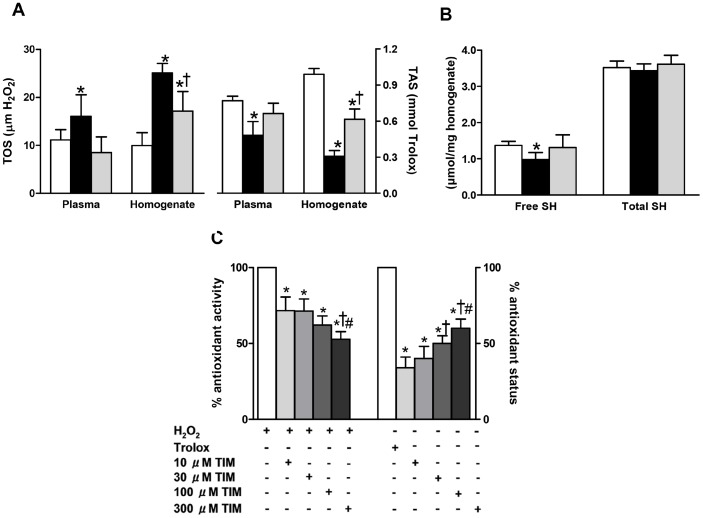
Figure 8. Confirmation of antioxidant effect of timolol on the contractile activity of diabetic rat heart via using different biochemical approaches.
The total oxidant status measured with respect to H2O2 and the total antioxidant status measured with respect to trolox (A) in both plasma and heart homogenate of control rats (CON group; white bar) and diabetic rats without treatment (DM group; black bar) or with TIM treatment (DM+TIM group; gray bar) for 4-week following the one week of diabetic status confirmation. (B) The total and free protein thiol levels measured in heart homogenate of the groups. Bars represent mean ± SEM. The number of rats is 12–17 for rats/group/protocol. Significant at *p<0.05 vs. CON group, †p<0.05 vs. DM group. (C) In vitro antioxidant activity and antioxidant status of TIM was measured with colorimetric methods. Antioxidant activity of increasing concentration of TIM is evaluated with absorbance changes in H2O2-induced signal. Bar graphs represent mean ± SEM values for 10-30-100-300 μM TIM applications on H2O2 included samples for expressing antioxidant activity. Bar graphs represent mean ± SEM values from Trolox or 10-30-100-300 μM TIM applications on ABTS chromogen solution for expressing antioxidant status (triple assays in each sample for each type of measurement). Significant at *p<0.05 vs. H2O2 or Trolox, and †p<0.05 vs. 10-μM TIM, #p vs. 30-μM TIM.

