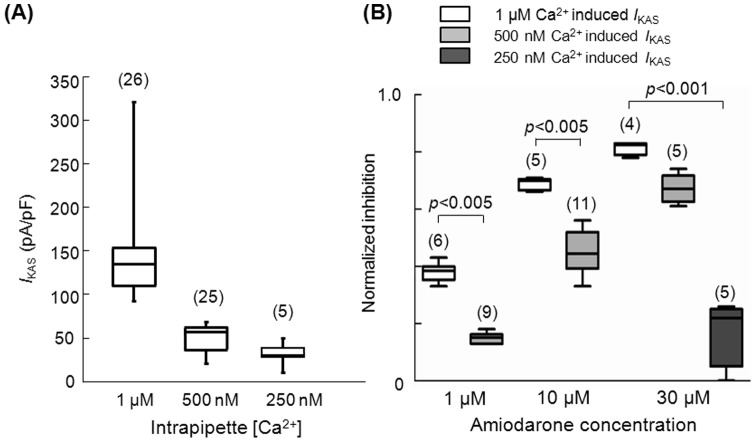
Figure 5. Density of I KAS and its inhibition by amiodarone is dependent on the intracellular Ca2+ concentration.
(A) I KAS densities obtained with three different intrapipette Ca2+ concentrations. The box-plot indicates the median and 25 and 75 percentile values. The whiskers indicate the minimum and maximum values. (B) Inhibitory effects of various concentrations of amiodarone on I KAS induced with various intrapipette Ca2+ concentrations as shown in the top labels. In the left panel, inhibitory effects of 1 μM amiodarone were tested on I KAS induced with two different intrapipette Ca2+ concentrations (1 µM and 500 nM). In the mid panel, inhibitory effects of 10 μM amiodarone were tested on I KAS induced with two different intrapipette Ca2+ concentrations (1 µM and 500 nM). In the right panel, inhibitory effects of 30 μM amiodarone were tested on I KAS induced with three different Ca2+ concentrations (1 µM, 500 nM and 250 nM). Inhibition of 250 nM Ca2+ induced I KAS by 1 µM and 10 µM amiodarone is not shown since this was almost undetectable. The numbers in parentheses indicate the number of patches.

