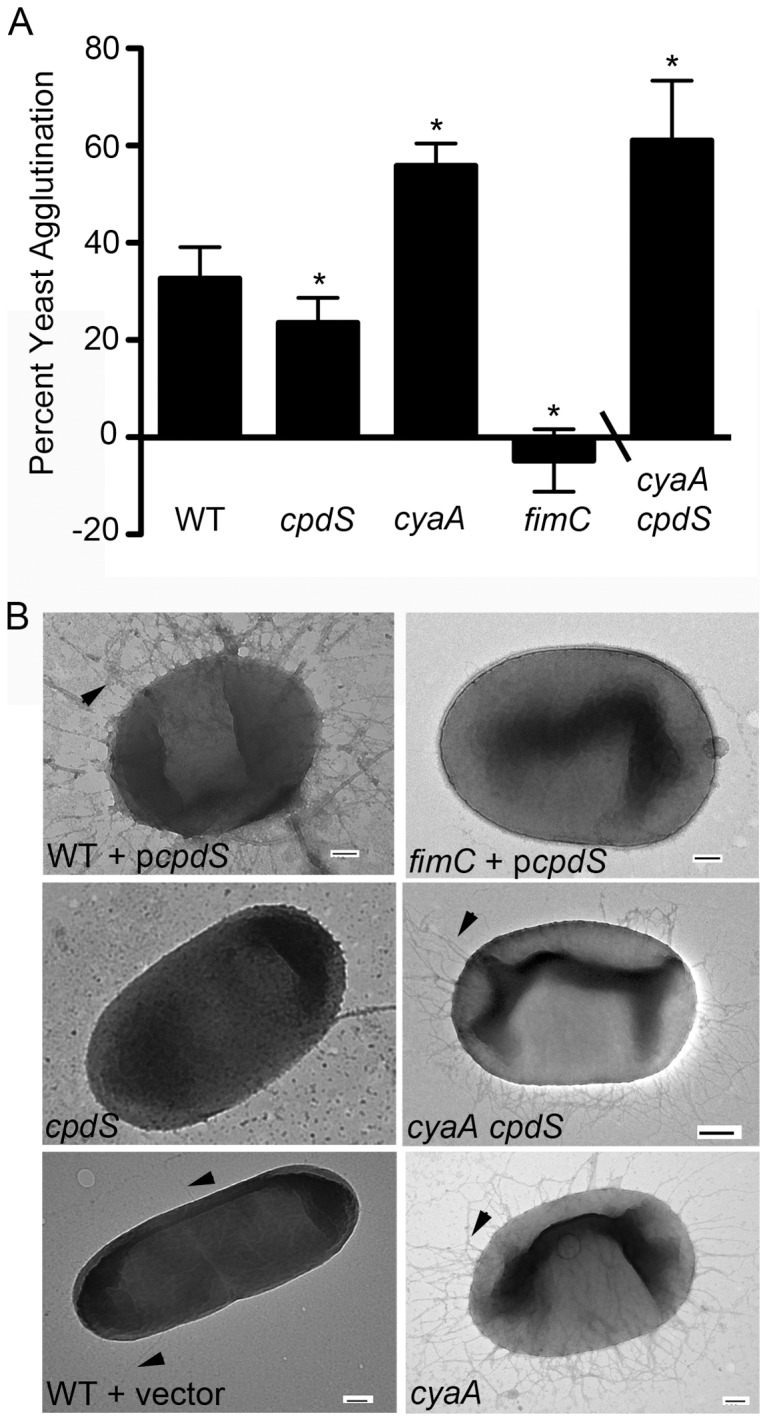
Figure 5. The cpdS mutant has reduced surface fimbriae.

A. A yeast-agglutination assay was used to quantitate relative fimbriae expression. The asterisk indicates statistical difference from wild-type levels (n = 9, p<0.05, ANOVA with Tukey's post-test or Student's T-test). The cyaA cpdS double mutant data was from a different experiment (n = 6). B. Representative TEM micrographs of relevant strains. Black arrow-heads indicate fimbriae. Bar = 100 µm.
