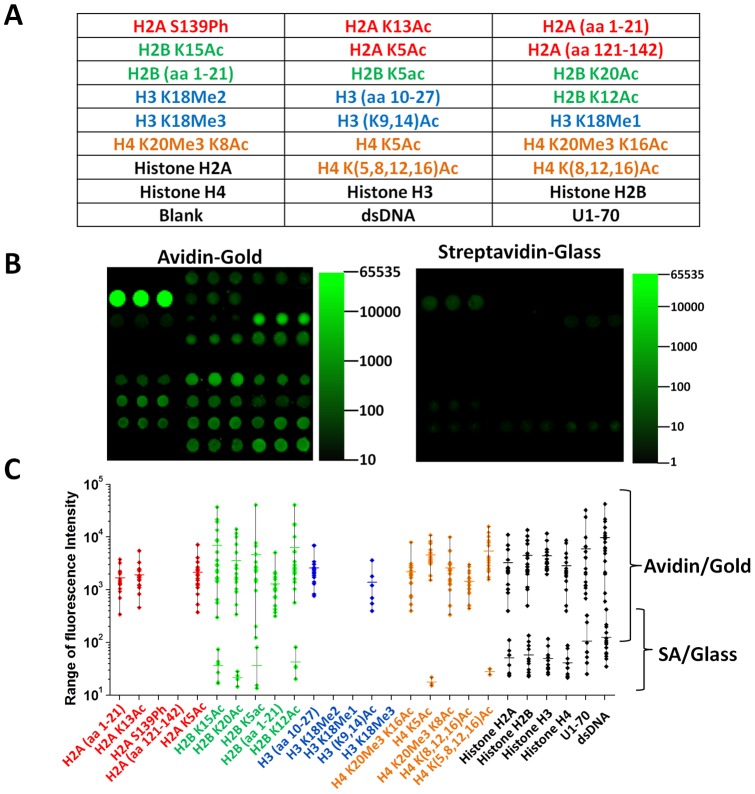
Figure 3. An integrated peptide-antigen microarray for profiling serum antibodies of 20 patients with systemic lupus erythematosus (SLE).
A) Peptide-antigen microarray layout including modified and unmodified histone H2A, H2B, H3, H4 peptides as well as whole antigens. Ac: acetylated; aa: amino acid; Me1: methylated; Me2: dimethylated; Me3: trimethylated; Ph: phosphorylated; K: Lysine; S: Serine. Number indicates amino acid position from the N-terminus of its corresponding histone proteins. Peptide sequences are listed in Table S1. B) Microarray imaging results of a SLE patient serum probed on a plasmonic gold substrate (left) vs. on a commercial streptavidin-glass substrate (right) shown in the same IRDye800 fluorescence intensity scale. C) Dynamic range of fluorescence signal reading among 20 SLE patients measured on each peptide and antigen spots on avidin/gold slide (upper panel) and commercial streptavidin/glass slide (lower panel). Each dot represents a fluorescence intensity measured on a peptide or antigen spot shown along the x-axis in the serum of each of the 20 SLE patients. A dot is drawn only when the fluorescence intensity is above the background by 2 standard deviation of the background signal.

