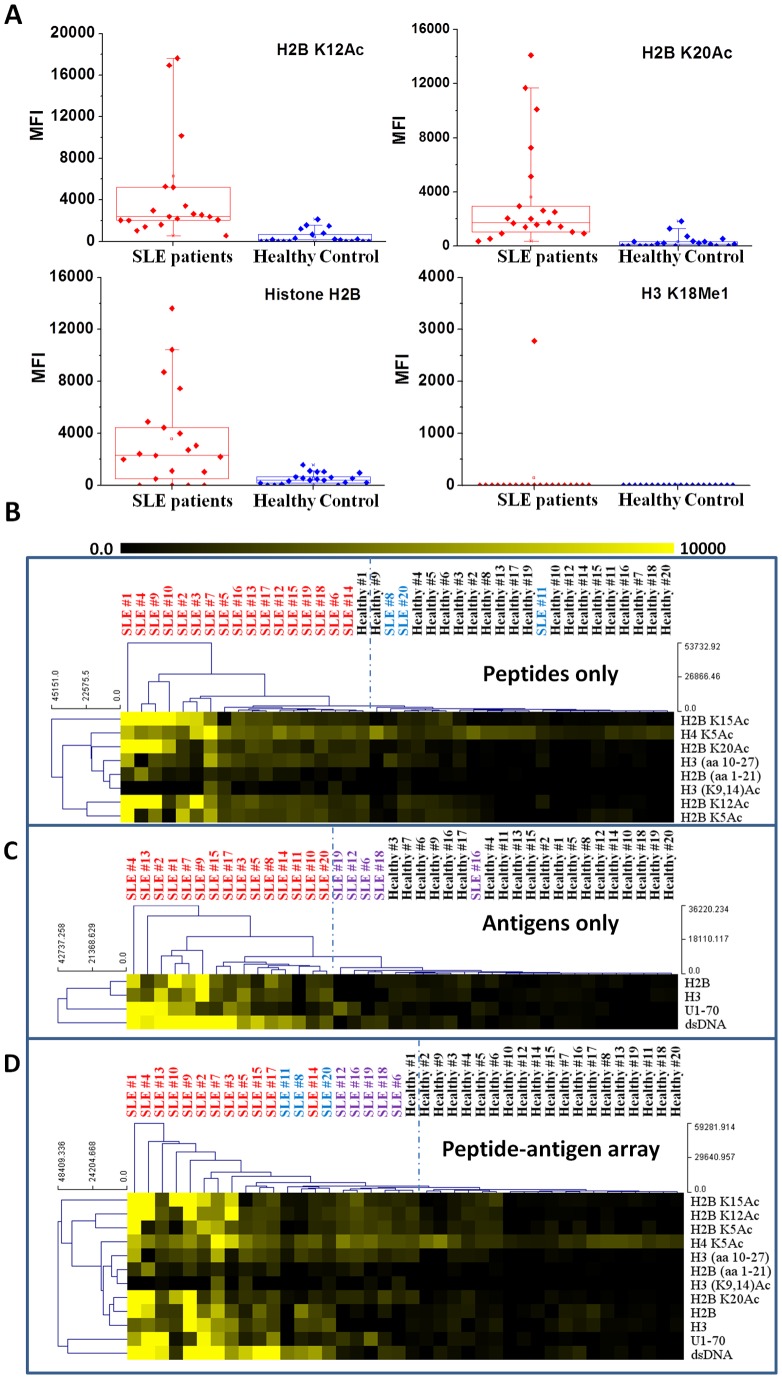
Figure 4. Peptide-antigen microarrays on plasmonic gold substrate for profiling antibodies in serum samples of SLE patients and healthy individuals.
A) Box plot of serum IgG antibody reactivity against several peptides and a whole antigen for 20 SLE patients and 20 healthy controls. Acetylated histone H2B peptides were found to be able to differentiate SLE patients and healthy controls (top box plots) together with whole H2B protein (bottom left box plot). While the H3 peptide with the 18th lysine methylated were found not capable of telling SLE patient from healthy control (bottom right box plot). B–D) Heatmaps displaying antibody reactivity to (B) histone peptides only, (C) whole antigens only, and (D) a combination of histone peptides and whole antigens that are identified capable of differentiating SLE patients and healthy controls with false discovery rate (q value) <0.001. The dashed lines are drawn to highlight the separation of SLE and healthy groups identified by using the average linkage Euclidean distance hierarchical clustering method. Color intensity of each grid in the heatmap reflected mean fluorescence intensity of corresponding peptide or antigen spot on the microarray for each SLE patient or healthy individual. In (B) and (C), several SLE patients (labeled in blue and purple color) are misplaced in the healthy group. These patients are grouped in the SLE side in (D) that profiles antibodies against both peptides and whole antigens. However, one healthy individual is mis-placed in the SLE group by this approach, reducing the specificity of this analysis.

