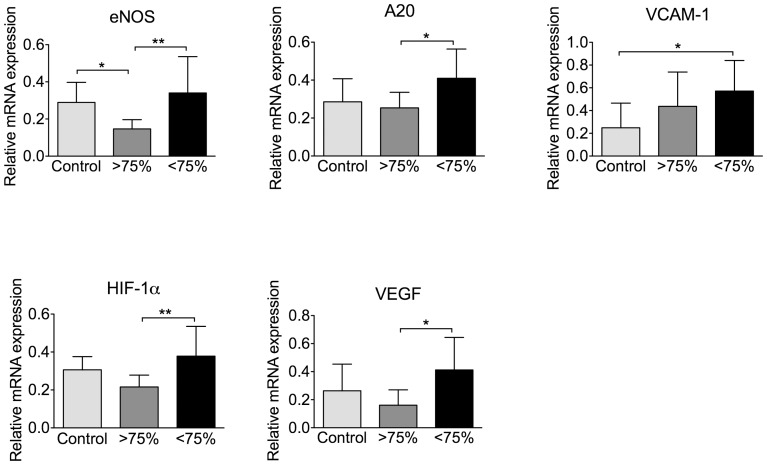
Figure 2. Expression of select genes in skin of OSA patients is differently regulated in severely hypoxemic (<75% blood oxygen saturation) and mildly hypoxemic (≥75% blood oxygen saturation) OSA groups.
Gene expression in skin biopsies obtained from OSA patients and control subjects was analyzed by qRT-PCR using specific primers, and is presented as relative mRNA expression versus a control group. Results for each sample were normalized versus 28S. n = 10–12. Data are presented as mean +/− SDEV. * p<0.05; ** p<0.005. There is a global statistical significance for all genes in three groups of studied subjects. ≥75% – OSA group with mild hypoxemia; <75% – OSA group with severe hypoxemia.

