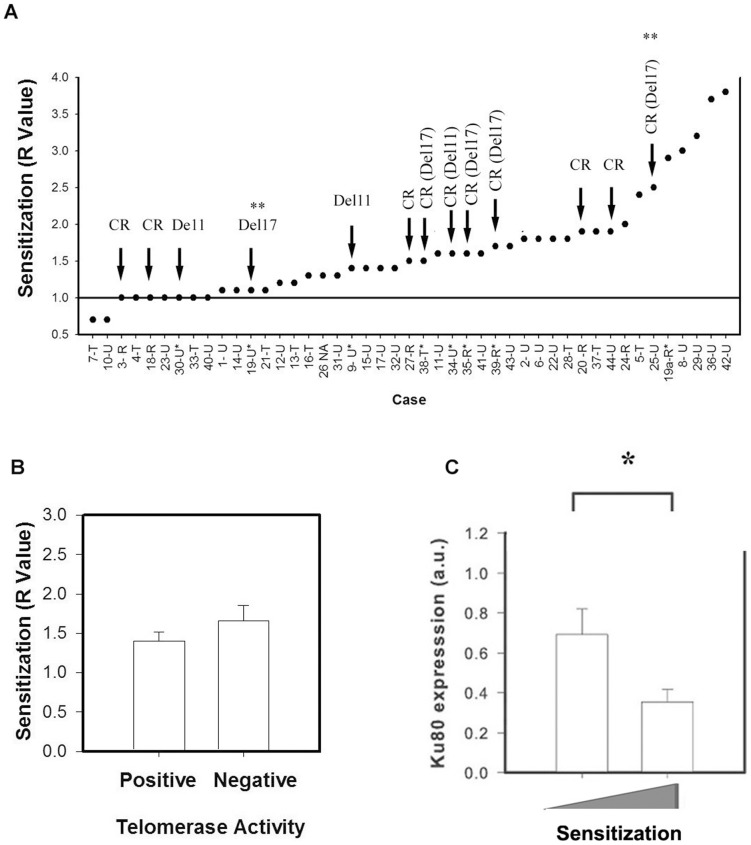
Figure 2. Imetelstat-mediated sensitization to FLU is associated with Ku expression.
A) The plot represents the sensitization values obtained (y-axis) for CLL lymphocytes from each case (x-axis). The arrows indicate the clinically resistant (CR) cases and cases positive for del11 and del17. The ** indicated a del17 case that changed from untreated to clinically resistant with increased percentage of cells positive for del17 (Table S1). B) Comparison of the sensitization R values (y-axis) between telomerase negative (right bar) and telomerase positive samples (left bar) (Mann-Whitney Rank Sum Test p = 0.295). C) Ku80 expression (y-axis) in primary CLL lymphocytes samples segregated by the median R value (1.5) (Mann-Whitney Rank Sum Test *p = 0.03).

