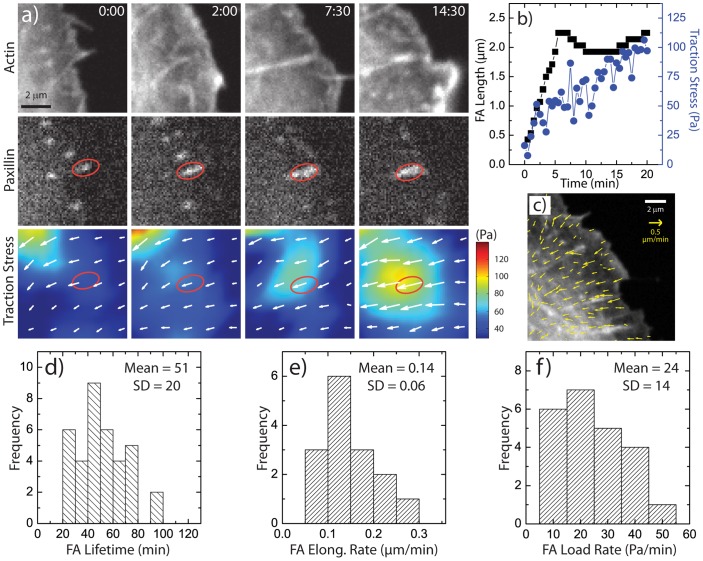
Figure 1. Focal Adhesion Maturation in Wild Type Cells.
(a) Time-lapse images of a U2OS cell expressing GFP-actin and mApple-paxillin, with images of traction stress magnitude and overlaid traction stress vectors. Time is in min:sec. (b) Plot of focal adhesion length (black squares) and traction stress (blue circles) at the focal adhesion (FA) indicated in (a) as a function of time. (c) Region of a U2OS cell with overlaid actin retrograde flow vectors. (d) Histogram of FA lifetimes in U2OS cells. (e) Histogram of FA elongation rate, measured by the rate of change in the length during FA elongation. (f) Histogram of focal adhesion loading rate, measured by the rate of change of the traction stress during FA elongation.

