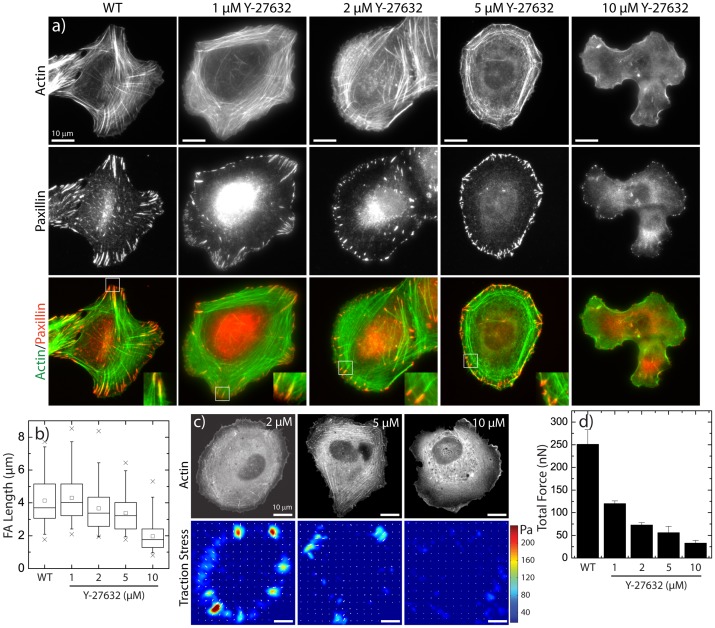
Figure 2. Focal Adhesion Morphology and Traction Forces under Treatment with ROCK inhibitor Y-27632.
(a) Images of F-actin visualized by fluorescent phalloidin (top row) and paxillin immunofluorescence (middle row) in U2OS cells treated with the indicated concentrations of the rho-kinase inhibitor, Y-27632. (b) Box plots of FA lengths in U2OS cells as a function of Y-27632 concentration (n = 101 (WT), 78 (1 µM), 134 (2 µM), 117 (5 µM), 124 (10 µM) FAs). (c) Representative GFP-actin images (top row) and traction stress maps (bottom row) and for U2OS cells treated with 2, 5 and 10 µM Y-27632. (d) Plot of the total traction force exerted by U2OS cells as a function of Y-27632 concentration (n = 23 (WT), 13 (1 µM), 8 (2 µM), 14 (5 µM), 6 (10 µM) cells).

