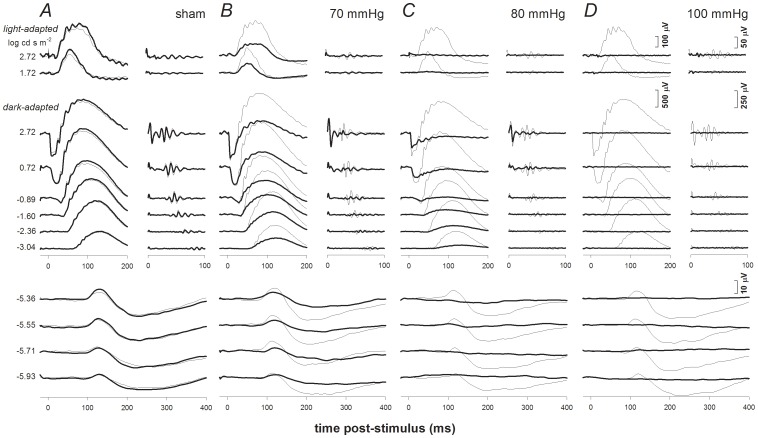
Figure 1. Representative individual examples of ERG findings 4 weeks after acute IOP elevation for selected groups.
ERG responses for experimental eyes (bold traces) and their fellow control eyes (thin traces) are shown for the following groups: sham (Column A), 70 mmHg (Column B), 80 mmHg (Column C) and 100 mmHg (Column D). Stimulus flash intensities are listed at left for scotopic (below) and photopic (above) responses. Isolated OPs are shown to the right of corresponding waveforms.

