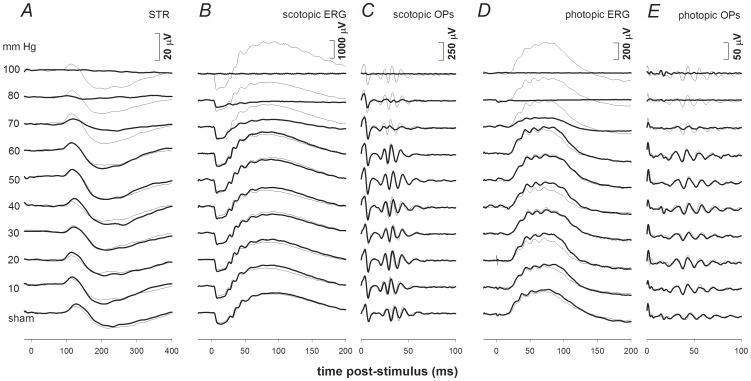
Figure 2. Representative ERG findings for experimental eyes (bold traces) 4 weeks after challenge for all IOP levels.
Selected stimulus conditions are shown to emphasize various components of the ERG: scotopic threshold response (STR, −5.55 log cd s m−2, Column A) the scotopic bright flash ERG (2.22 log cd s m−2, Column B) and OPs (Column C), as well as the photopic ERG (2.72 log cd s m−2, Column D) and Ops (Column E). ERG responses for fellow control eyes are shown by the thin traces in each column. IOP levels are indicated on the left.

