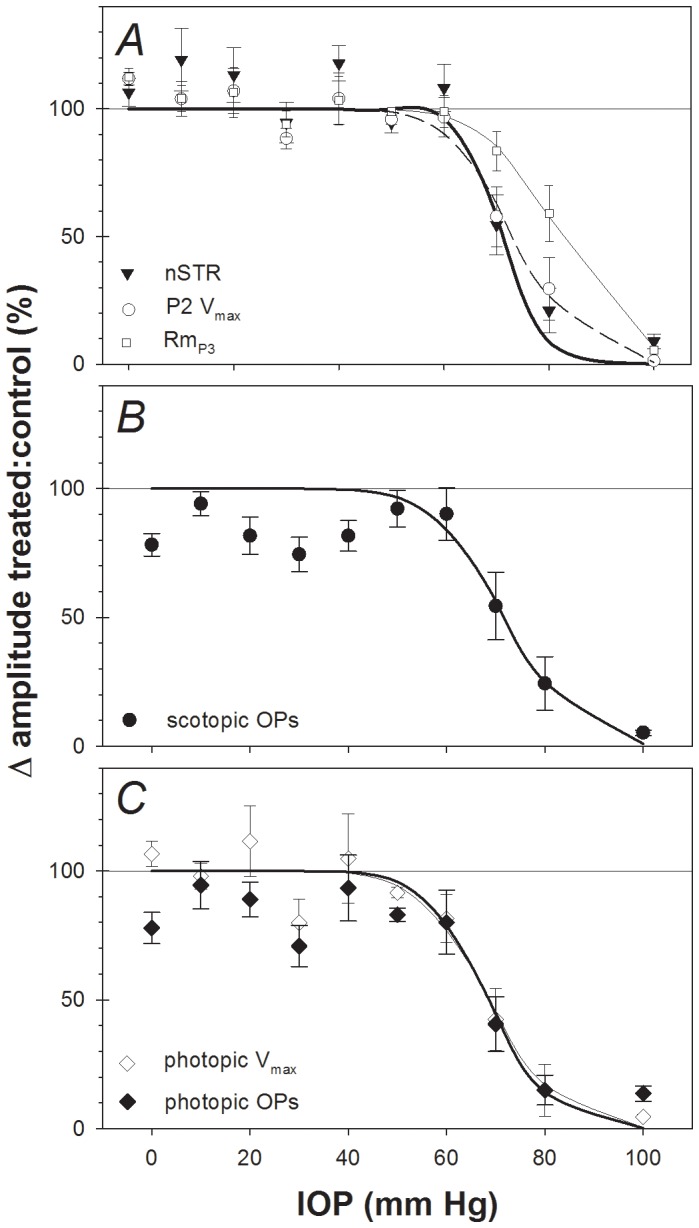
Figure 4. Relative change across ERG components 4 weeks following acute IOP insult.

(A) nSTR (filled triangles), P2 amplitude (Vmax, open circles) and photoreceptoral amplitude (RmP3, filled squares). For comparison, the corresponding best-fit cumulative normal functions are also plotted in panel A for the nSTR (thin solid curve), P2 (Vmax, dashed curve) and a-wave (RmP3, bold curve). (B) Scotopic OP amplitude. (C) Photopic b-wave amplitude (Vmax, open diamonds) and photopic OP amplitude (filled diamonds). For clarity, the best-fit cumulative normal functions are omitted from panels B and C.
