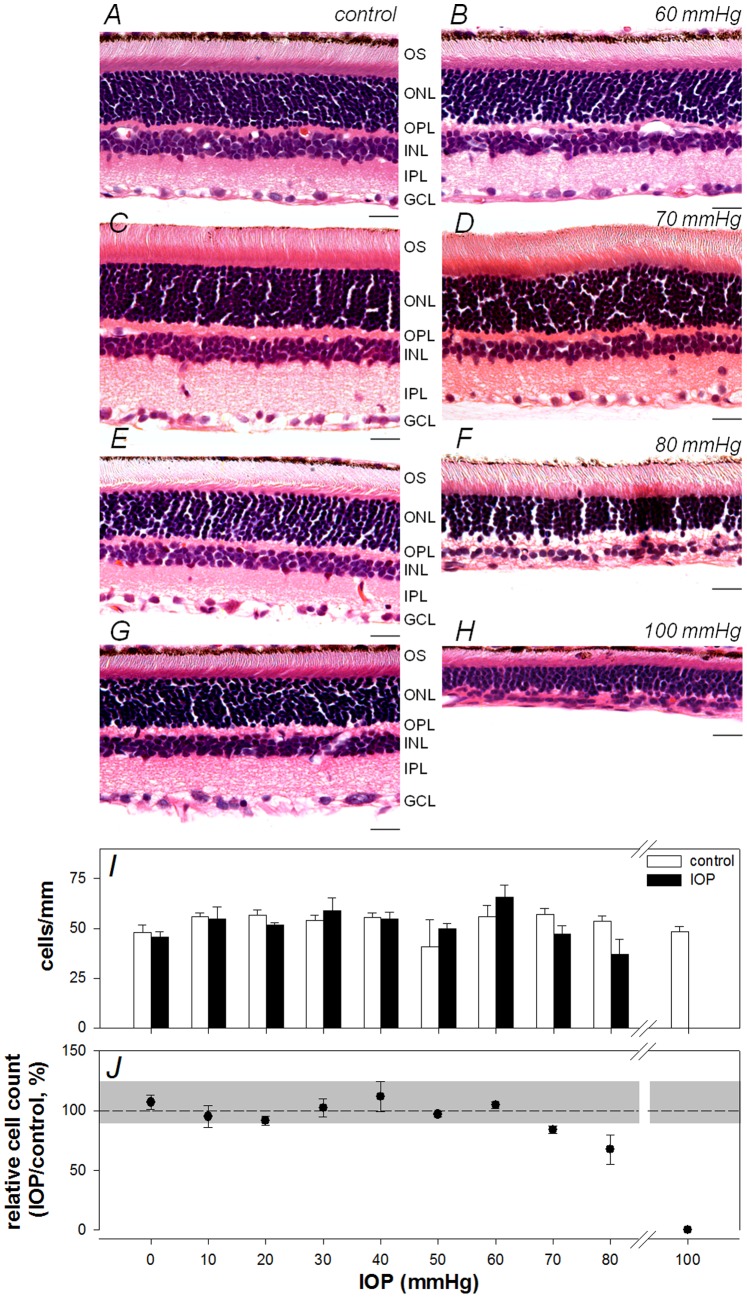
Figure 6. The effect of acute IOP elevation on retinal structure.
Representative histological sections for selected IOP levels, 60 mmHg (A: control, B: IOP), 70mmHg (C: control, D: IOP), 80 mmHg (E: control, F: IOP), 100 mmHg (G: control, H: IOP). Scale bar = 20 µm (I) Mean (± SEM) RGC layer density for control (unfilled) and IOP treated eyes (filled) is shown across increasing IOP levels. (J) Relative RGC layer density (treated/fellow control eye, mean ± SEM, %) as a function of IOP. Grey area represents 95% confidence limits for % difference between eyes of the sham group.

