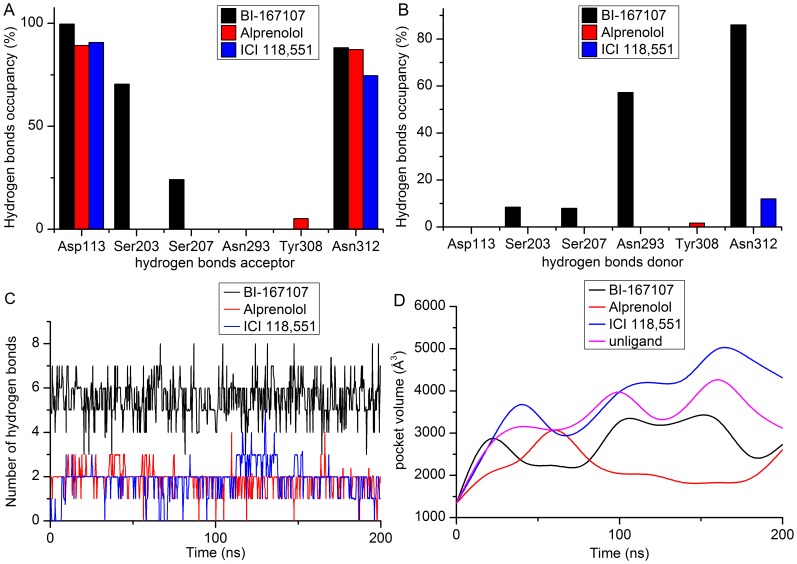
Figure 3. The hydrogen bonds occupancy and volume of binding pocket.
(A–B) The column represents the percent of hydrogen bonds occupancy when the residues are as hydrogen bonds acceptor or donor in the pocket of β2AR. (C) The total number of hydrogen bonds versus the simulated time. (D) The ligands-bound pocket volume of β2AR versus the simulation time.

