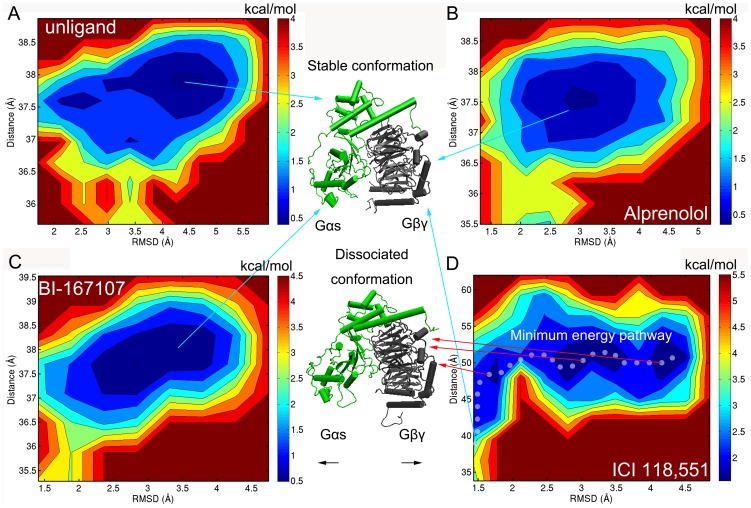
Figure 6. Energy landscape of Gαs and Gβγ.
(A–D) The energy landscape map of Gαs and Gβγ in complex without ligand or with alprenolol, BI-167107 and ICI 118,551. Reaction coordinates are defined two parts: the centroid distance between Gαs and Gβγ; the RMSD of Gαs and Gβγ. The white points represent the minimum energy pathway.

