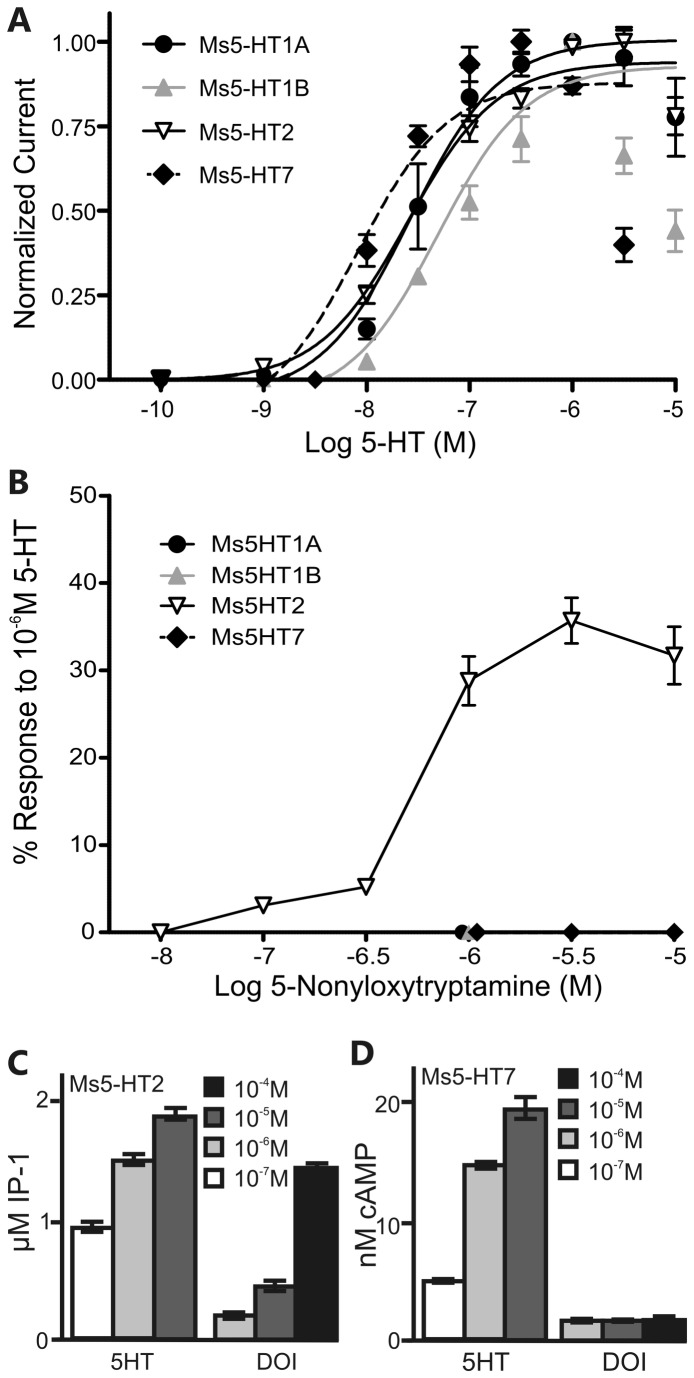
Figure 3. Responses of the Ms5HTRs for 5-HT and the dose response curves for selective agonists.
(A) Currents (normalized to maximal responses) evoked by increasing concentrations of 5-HT (from 0.1nM to 10 µM) in Xenopus laevis oocytes expressing the Ms5HT1A (black circle), Ms5HT1B (grey triangle), Ms5HT2 (open triangle), Ms5HT7 (black diamond). (B) Xenopus oocytes expressing the Ms5HT2 receptor (open triangle) respond to 5-nonyloxytryptamine at 0.1 µM and above, while oocytes expressing the Ms5HT1A (black circle), Ms5HT1B (grey triangle) or Ms5HT7 (black diamond) receptors do not respond at any of the concentrations tested. The symbols for the Ms5HT1A, 1B and 7 receptors have been staggered for clarity. In (A) and (B) the 5HT1A responses were measured in oocytes co-injected with receptor cRNA and cRNA for the CFTR channel whilst the 5HT1B, 5HT2 and 5HT7 responses were measured in oocytes injected with the receptor cRNA alone. Oocytes were exposed to 2 min pulses of the agonists at various concentrations. (C) HEK293 cells expressing the Ms5HT2 receptor respond (measured as nM concentration of IP-1/well of a 96 well plate) to 5-HT and DOI (4-Iodo-2,5-dimethoxy-α-methylbenzene ethanamine). (D) HEK293 cells expressing the Ms5HT7 receptor respond (measured as nM concentration of cAMP/well of a 96 well plate) to 5-HT, but not DOI. Shades of grey in (C) and D) indicate concentration of pharmacological agent applied. All error bars represent SEM.

