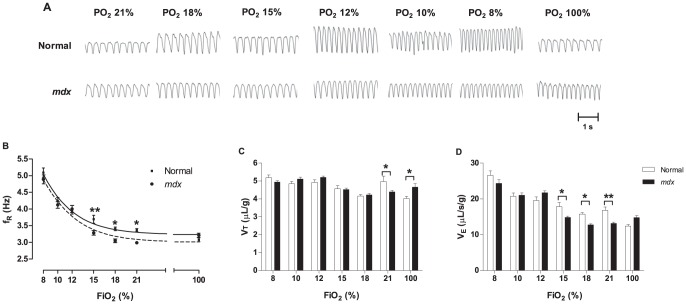
Figure 1. HVR of normal and mdx mice exposed to different FiO2 levels.
A) Representative inspiratory and expiratory flows obtained from normal (top) and mdx mice (bottom) exposed to FiO2 21, 18, 15, 12, 10, 8 and 100%. Each animal was challenged three times with each FiO2. The scale for tidal volume (VT, µL) and time (s) are shown at bottom right. B) Quantification of respiratory frequency (f
R, Hz), C) tidal volume normalized by body weight (µL/g) and D) minute ventilation ( ) normalized by body weight (µL/s/g) from normal (empty bars) and mdx (filled bars) mice at each FiO2 levels tested. Mean ± SEM; * p<0.05; ** p<0.01, n = 5.

