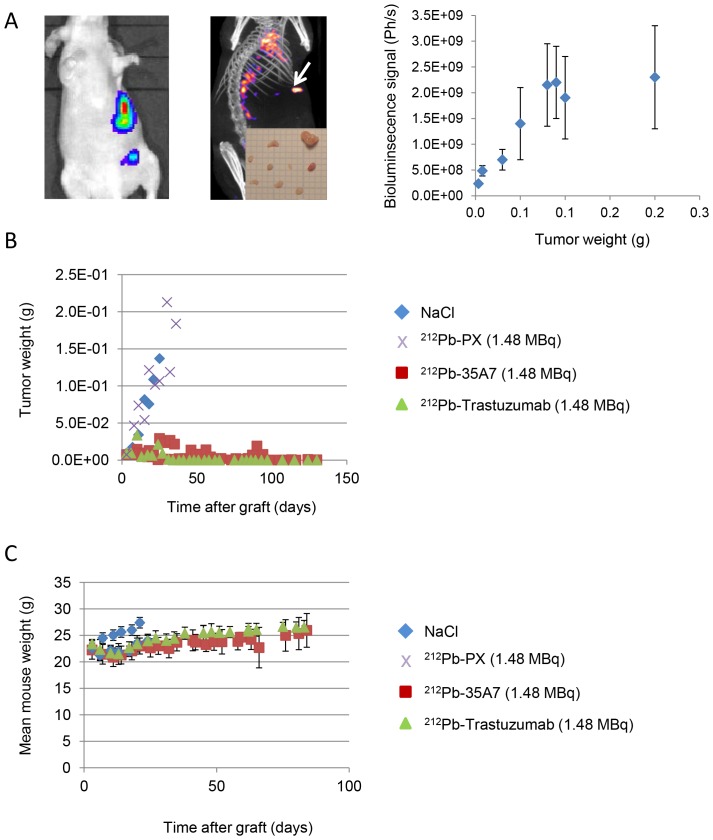
Figure 1. Follow-up of tumor growth and animal weight.
(A) Tumor growth was determined by bioluminescence (left) and SPECT-CT imaging (middle). Only the biggest tumor nodules (arrow) could be detected by SPECT-CT imaging at day 1 after injection of 185 MBq 125I-35A7. Bioluminescence signal (photons/s) was calibrated as a function of the tumor mass and showed a linear relationship for tumors between 0.01 and 0.08 g (right). Calibration curve equation was y (g) = photons/s×5.0 10−11. For larger tumors, signal was saturating. (B) The bioluminescence signal was converted into tumor weight (g) using the calibration curve and plotted versus time post-graft. (C) The mean mouse weight in each treatment group was determined weekly.

