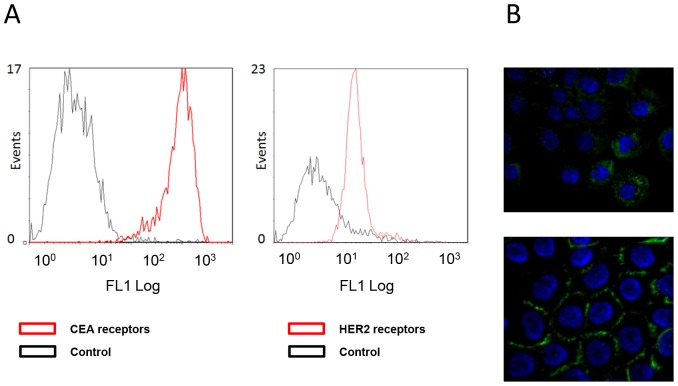
Figure 3. Cell surface receptors and mAbs localization.
(A) Flow cytometry analysis of cell surface CEA (left panel) and HER2 (right panel) expression in A-431 cells using the anti-CEA 35A7 and anti-HER2 trastuzumab mAbs, respectively. Control cells were incubated only with the FITC-labelled secondary antibody. (B) Immunofluorescence analysis of the cell localization of trastuzumab (upper panel) and 35A7 (lower panel). Nuclei were stained with Hoechst.

