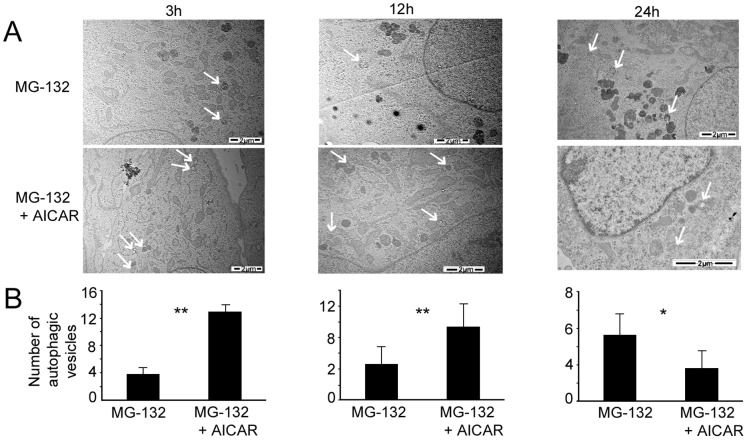
Figure 5. Transmission electron micrographs of ARPE-19 cells exposed to AICAR or/and MG-132 and autophagic vesicles quantification.
(A) Representative transmission electron micrographs of ARPE-19 cells exposed to MG-132 5 µM solely and with AICAR 2 mM for 3 h, 12 h and 24 h. Autophagic vesicles are indicated by arrows. (B) Quantification of autophagic vesicles in ARPE-19 exposed to MG-132 5 µM solely and with AICAR 2 mM for 3 h, 12 h and 24 h. Six parallel samples were measured in all treatments. *p<0.05, **p<0.01, Mann–Whitney.

