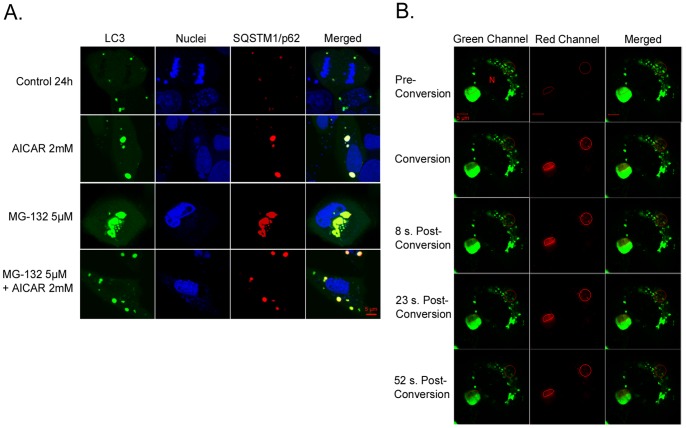
Figure 6. Colocalization of SQSTM1/p62 and MAP1LC3A/LC3 and position changes of SQSTM1/p62, revealed by confocal microscopy analysis.
A light merge orange/yellow signal of colocalizing MAP1LC3A/LC3 (pDendra2-hLC3, green) and SQSTM1/p62 (pDsRed2-hp62, red) is detectable, usually near to the cell nuclei. Nuclei are stained with blue dye. The scale bar equals to 5 µm. (A): Confocal microscopy images of untreated control ARPE-19 cells and cells exposed to AICAR 2 mM or/and MG-132 5 µM for 24 h. A = Aggregates (B): Position of SQSTM1/p62 (pDendra2-hp62) in ARPE-19 cells, revealed by confocal microscopy analysis. SQSTM1/p62 in two different areas was photoconverted within approximately 7 sec (circled). Within 1 minute after photoconversion, the photoconverted SQSTM1/p62 is stationary. Cells have been exposed to 5 µM MG-132 for 24 h. N = Cell nucleus.

