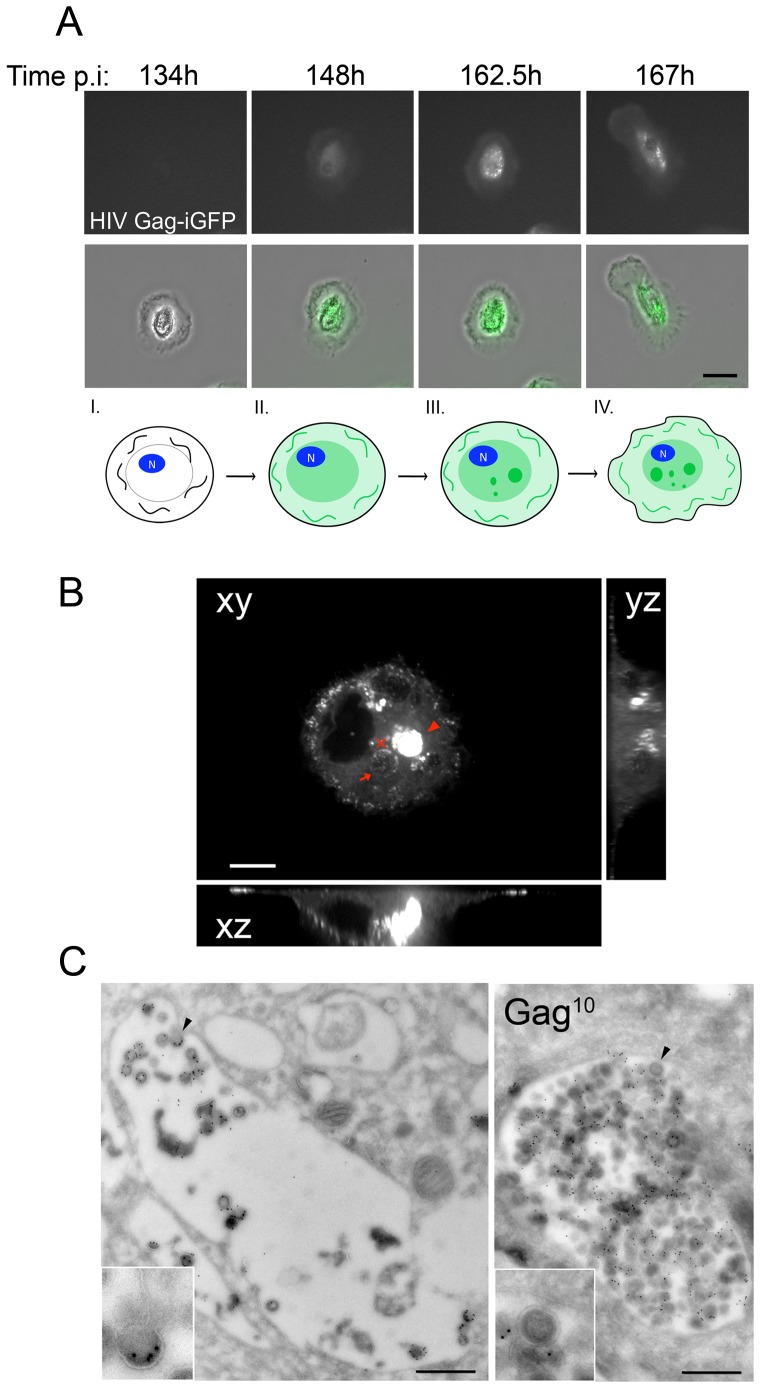
Figure 1. Characterization of the Virus-Containing Compartments.
(A) Dynamic imaging of the HIV cycle in macrophages. Macrophages infected with HIV Gag-iGFP virus were imaged from 1 to 8 dpi. To minimize photo-cytotoxicity, images were acquired every 15 min with an epifluorescent Biostation microscope (see Supplemental Video S1). Here are presented 4 snapshots from the movie at the indicated times post infection. Epifluorescent and corresponding transmission images are presented. Bar 20 µm. Bottom diagram. Schematic representation of Gag expression in infected macrophages at four morphologically distinct stages corresponding to the images presented above. (I) Gag is not yet expressed (II) Gag is detected in the cytosol in a diffuse pattern (III) Gag concentrates in internal compartments that accumulate and are in motion, and (IV) macrophages become more motile. (B) Heterogeneity of the VCCs in primary macrophages. Spinning disk confocal micrograph of the central region of a macrophage infected for 5 days with HIV Gag-iGFP ΔEnv. Orthogonal plans (xz and yz) from the red cross are also presented. The arrow points to a compartment that, by time-lapse analysis (see corresponding Supplemental Video S2), contained few Gag+ structures moving fast in the lumen, while the arrowhead indicates a compartment that appeared full and still. Bar 5 µm. (C) VCCs exhibit heterogeneous density of virions. Ultrathin cryosections of macrophages infected with HIV-1 NLAD8 for 7 days were prepared and labeled for p17 with protein A coupled to gold 10 nm. Two examples of VCCs are shown, one is packed with virions (right), the other (left) only contains a few virions. Bar 500 nm.

