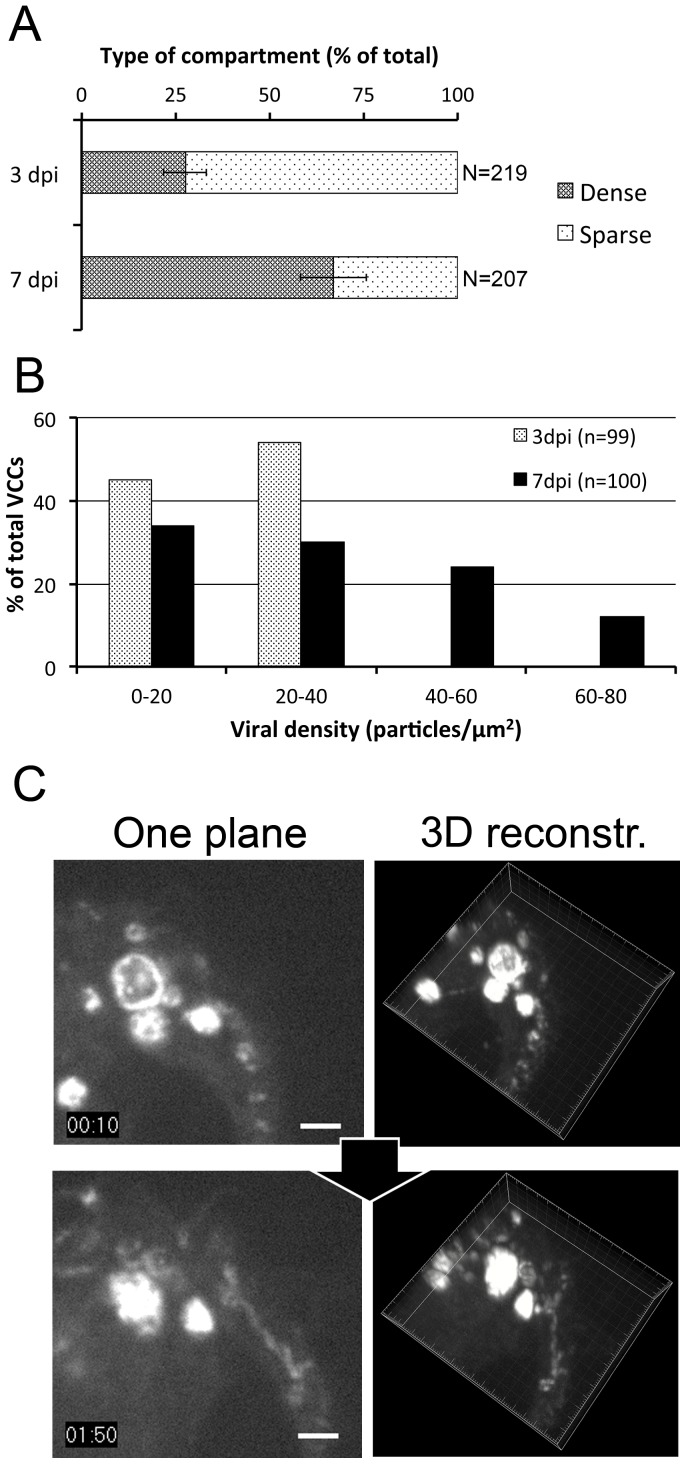
Figure 3. Virus-Containing Compartments fill up with time.
(A) Quantification of sparse versus dense VCCs at 3 or 7 dpi. Live macrophages infected with HIV Gag-iGFP ΔEnv were visualized by spinning disk confocal microscopy. Taking into account the compartments with a diameter superior to 1 µm, we considered a VCC as sparse when internal movement was detected; otherwise it was counted as a dense VCC. Values presented are means +/− SD of the percentage of sparse versus dense compartments calculated from 4 donors. Statistical significance was calculated for the differences between day 3 and 7 (p = 0.0003). (B) Quantification of viral density within VCCs at 3 and 7 dpi. Macrophages were infected with HIV NLAD8 and fixed at 3 or 7 dpi. Then, samples were embedded in epon for electron microscopy. For each VCC identified, the size of the VCCs and the number of particles per VCC were quantified. The graph represents the distribution of the viral particle density of the VCCs at both time points. (C) Time-lapse imaging of VCCs. Macrophages infected with HIV Gag-iGFP ΔEnv virus were imaged at 4 dpi during 2 h. Three-dimensional images were acquired every 5 min with a spinning disc microscope. Here are presented 2 snapshots (left panels) from the Supplemental Video S5 and their corresponding 3D reconstructions (right panels). A Gag-iGFP+ compartment is slowly filled. Note that two compartments fuse between 1∶30 and 2∶00 h. Bar 2 µm.

