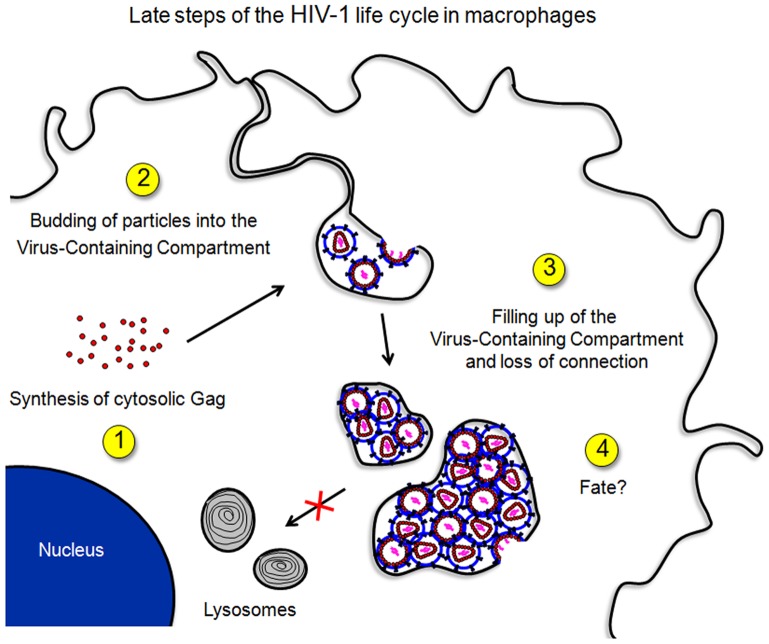
Figure 7. Schematic representation of HIV-1 production in primary macrophages.
(1) Following entry of HIV, it takes 1 to 3 days before cytosolic Gag becomes visible as a diffuse pattern. (2) VCCs are visible usually 0.5 to 1 day later. Transient connections to the plasma membrane are present via narrow microchannels. (3) Viral particles accumulate in VCCs filling them with time. (4) VCCs may reside inside the cell or travel toward the plasma membrane where they can release their viral content in the extracellular space.

