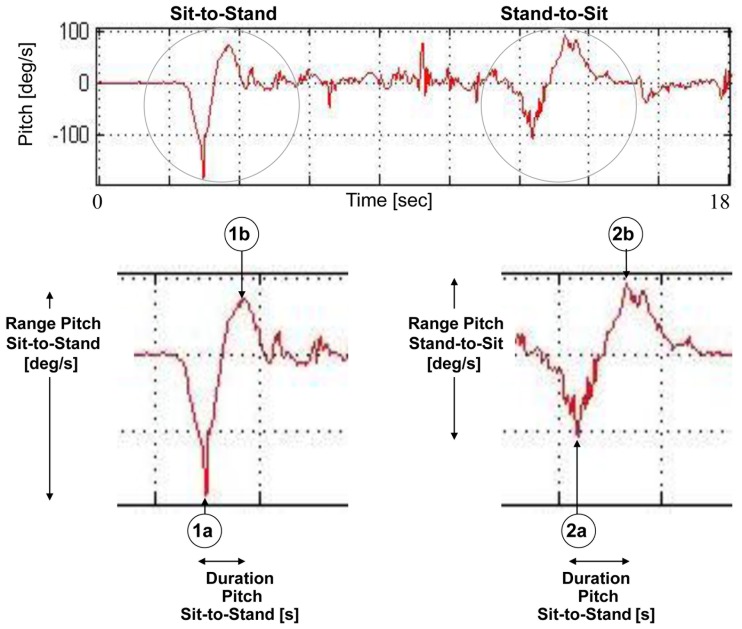
Figure 2. Transition measures from the pitch axis.
Transition components derived from the pitch axis. The upper figure shows the TUG pitch signal, where transition 1 (sit-to-stand) and transition 2 (stand-to-sit) components are evident as “tilted S” shaped objects. The lower figure shows a close-up of pitch transitions, with 1a and 1b as the minimum and maximum points of transition 1 (respectively), and 2a and 2b as the minimum and maximum points of transition 2, respectively. The pitch range [deg/s] and the transition duration [s] measures are depicted. The jerk, which is not shown here, is simply the slope of the pitch signal between the minimum and maximum points.

