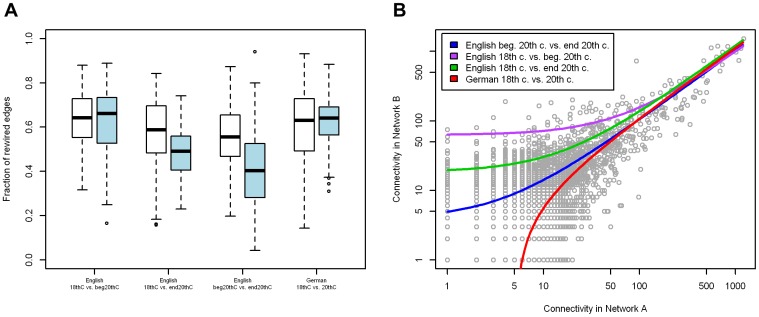
Figure 3. Connectivity of hub-morphemes.
A Boxplots of fractions of re-wired edges of hub-morphemes (connectivity ≥50). Blue = lost edges, white = gained edges. B Hubs stay hubs – connectivity values of two compared networks (English beginning 20th century vs. end 20th century, grey dots). Lines correspond to the fitted linear models on hub-values for each comparison.

