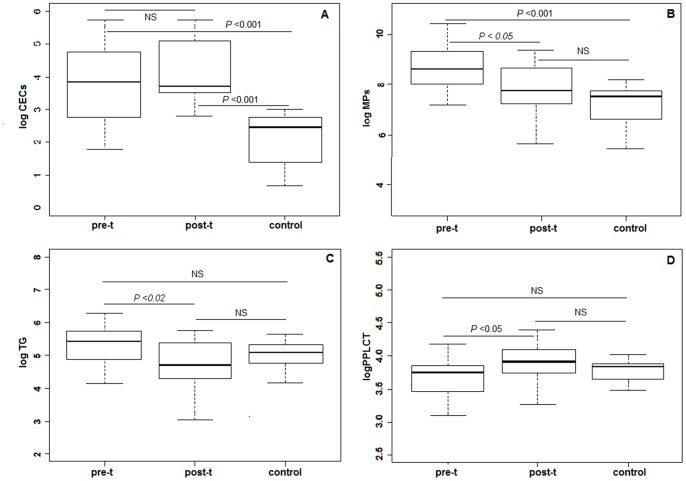
Figure 1. Pre- and posttreatment levels of biomarkers in patients and in controls.
A: Circulating endothelial cells (CECs), B: Microparticles (MPs), C: Endogen thrombin generation (TG); D: Procoagulant phospholipid-dependent clotting time (PPLCT). Marker levels and their standard deviations are shown for pre-t: pretreatment; post-t: posttreatment; c: controls. Logarithmic transformation of data was made to normalize the distributions. NS: no significant.

