
Figure 2. Kaplan-Meyer analysis of survival.
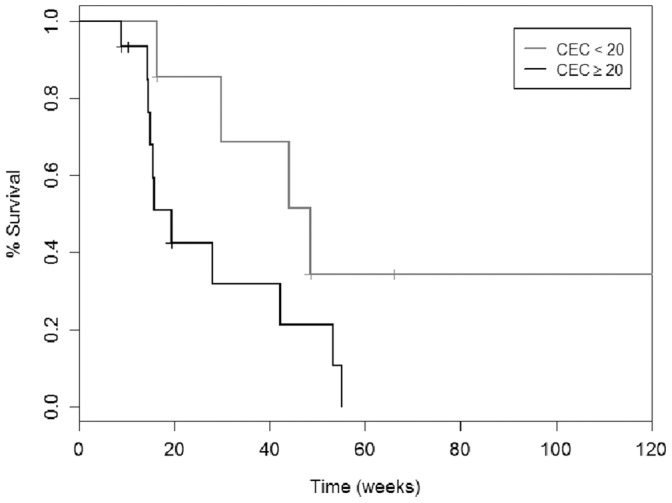
Overall survival curve according to pretreatment CECs values were dichotomized as greater than 99% confidence interval in controls (CEC = 20 cells/ml) (Log rank = 4.566; p = 0.033). CECs: circulating endothelial cells.