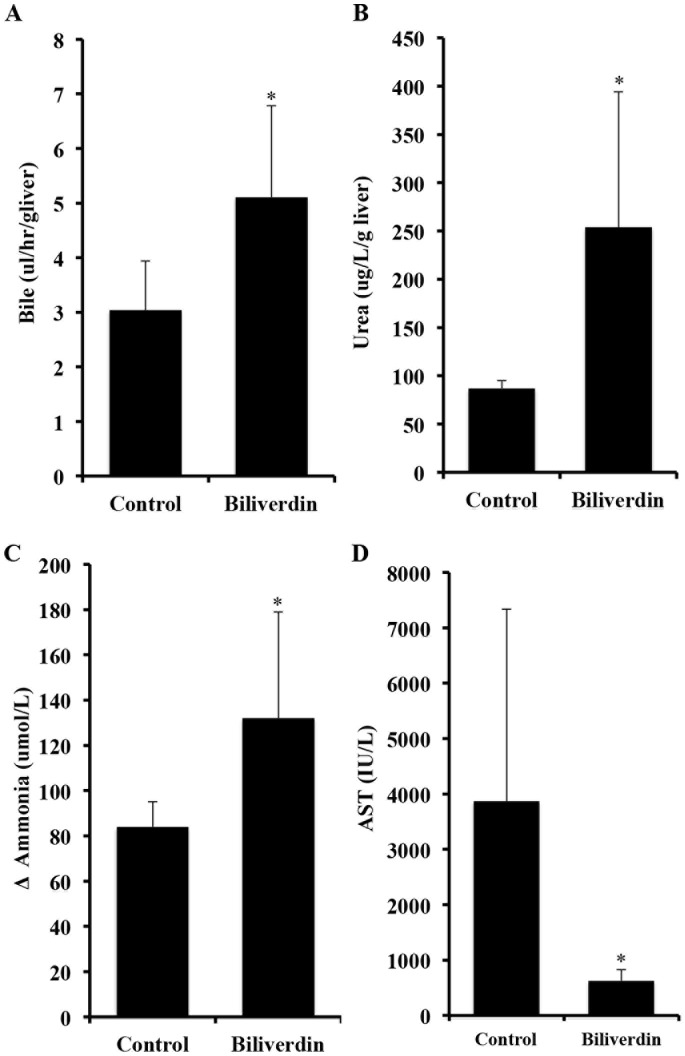
Figure 3. Effects of biliverdin on IRI-induced liver dysfunction.
A. Biliverdin was administered separately to both donors and recipients before surgery. Bile production as a measure of liver function was collected throughout the experiment and expressed as µl/hr/g liver. Control pigs show very little bile production during 12 hours of reperfusion. Note that biliverdin significantly improved bile production and thus is indicative of better liver function. Results are expressed as mean ± SD from 3 pigs/group. The increase in bile production is statistically significant comparing biliverdin vs Ctrl *p = 0.03. B. Effects biliverdin on urea production. Urea synthesis is expressed as the difference (Δ) of the urea concentration as µg/L/g liver. Results are expressed as means ± SD of 3 pigs/group. *p = 0.022 C. Effects of biliverdin on ammonia clearance. Biliverdin was administered as described above. Ammonia was measured in the serum and the clearance is expressed as a difference (Δ) in ammonia in µmol/L between the inflow and outflow ports of the perfused liver. Results are expressed as mean ± SD of 3 pigs/group. The Δ ammonia clearance is statistically significant between the biliverdin treated vs Ctrl groups, *p = 0.027. D. Effects of biliverdin on serum AST levels. Venous blood samples were taken before and every 2 hours after graft reperfusion and expressed as calculation of the total amount of serum AST released throughout the 12 hr experiment. Livers from untreated controls showed a significant increase in AST levels indicating severe liver damage. Administration of biliverdin prevented the damage and release of AST into the serum vs Ctrl *p = 0.021. Results are mean ± SD of 3 pigs/group.

