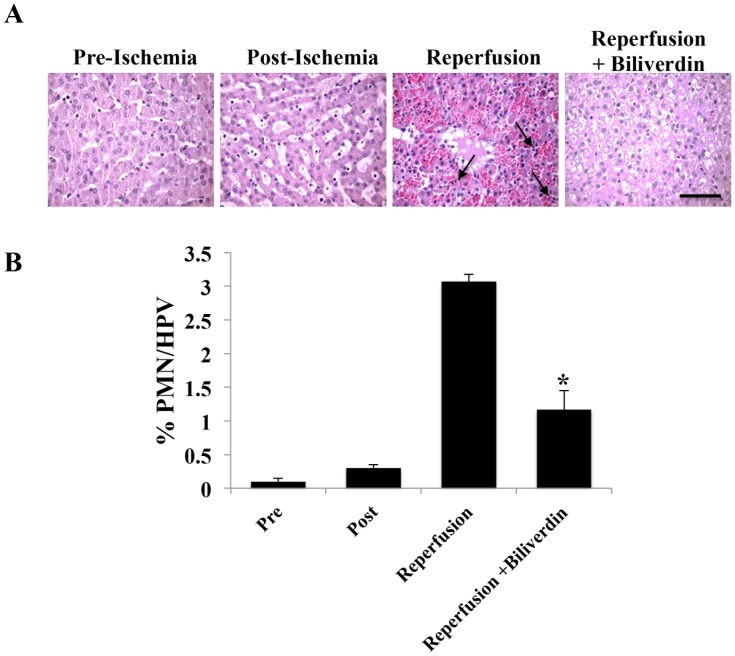
Figure 5. Effects of Biliverdin to Reduce Neutrophil Influx into the Liver.
A. Representative H&E staining of liver sections harvested pre-ischemia, immediately post-ischemia and 12 hrs after reperfusion ± BV treatment. B. Neutrophils were counted based on morphology and expressed as a percentage of neutrophils among the total number of cells present in each field. Data are expressed as mean ± SD of n = 3 pigs/group where a total number of cells counted was at least 500. Magnification = 400×, Bar represents 50 µm. (*p = 0.013).

