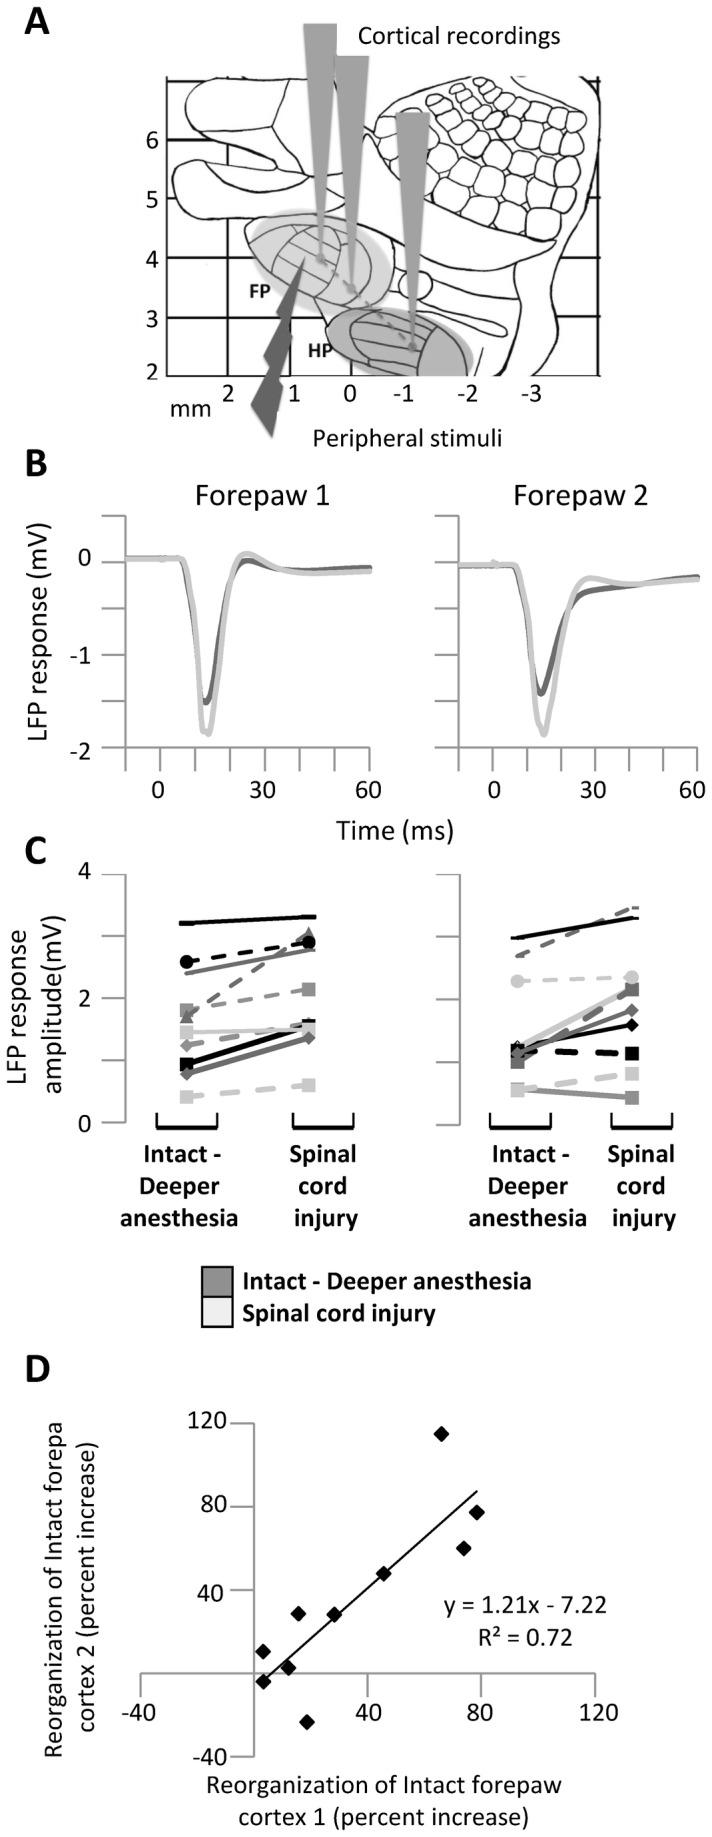
Figure 5. Spatial consistency within the forepaw cortex.

(A) Diagram representing the experimental protocol: on a schematic map of the rat primary somatosensory cortex, the gray cones represent the recording locations in the forepaw area (FP) and hindpaw area (HP) and the light arrow represents the peripheral electrical stimuli delivered to the forepaw. (B) Grand average LFP responses evoked in the two electrodes within the forepaw cortex by high-intensity forepaw stimuli before and immediately after spinal cord transection under deep anesthesia. (C) Corresponding variability of LFP response amplitude between animals. (D) Correlation in the reorganization of the intact forepaw cortex as measured by percent increase of the responses evoked by high-intensity forepaw stimuli (100*after transection/before transection-1) at the two forepaw electrodes. Both electrodes in the forepaw cortex show a similar state-independent increase in the responses evoked by high-intensity forepaw stimuli after spinal cord transection, confirming the spatial consistency of our results.
