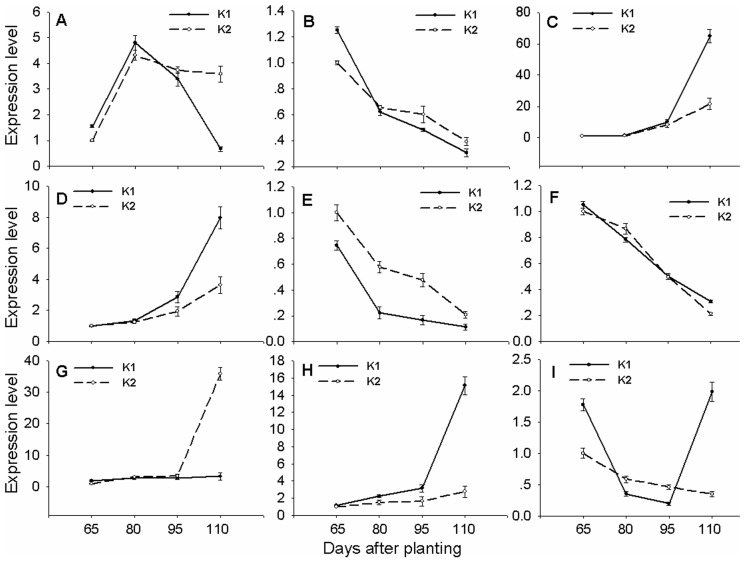
Figure 3. Senescence-dependent changes in gene expression determined by quantitative RT-PCR in the main-stem leaves of K1 and K2 cotton lines at 65, 80, 95 and 110 DAP.
A, Chlorophyll binding protein (LHCB; gene ID: EX169337). B, Large subunit of Rubisco, ribulose- 1,5-bisphosphate carboxylase/oxygenase (RBCL; gene ID: ES820978). C, Superoxide dismutase (SOD; gene ID: ES824305). D, Autophagy (ATG; gene ID: CO493577). E, Isopentenyltransferase (IPT; gene ID: DW494123). F, 9-cis-epoxycarotenoid dioxygenase (GhNCED2; gene ID: HM014161); G, 9-cis-epoxycarotenoid dioxygenase (NCED1; gene ID: EX168449). H, NAC domain protein (NAC; gene ID: CA992724). I, NAC domain protein (GhNAC6; gene ID: Dw517699). Expression ratios are presented relative to K2 values at 65 DAP. Data are means of three biological replicates ± SE.

