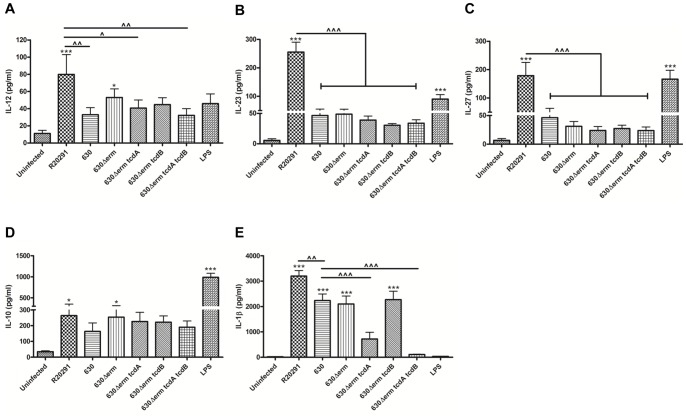
Figure 3. C. difficile-mediated effects on BMDC cytokine production.
BMDCs were infected with C. difficile cultures at an MOI of 10 and IL-12 (A), IL-23 (B) IL-27 (C), IL-10 (D) and IL-1β (E) was measured 8 h post-infection. 1 µg/ml LPS stimulation served as positive control. Data represent mean ± SEM of duplicate samples and are representative of three individual experiments. */∧p<0.05, ∧∧p<0.01 and ***/∧∧∧p<0.001 represent significant difference from uninfected cells and significant inter-strain difference. P values were obtained using ANOVA with Bonferroni post-test analysis.

