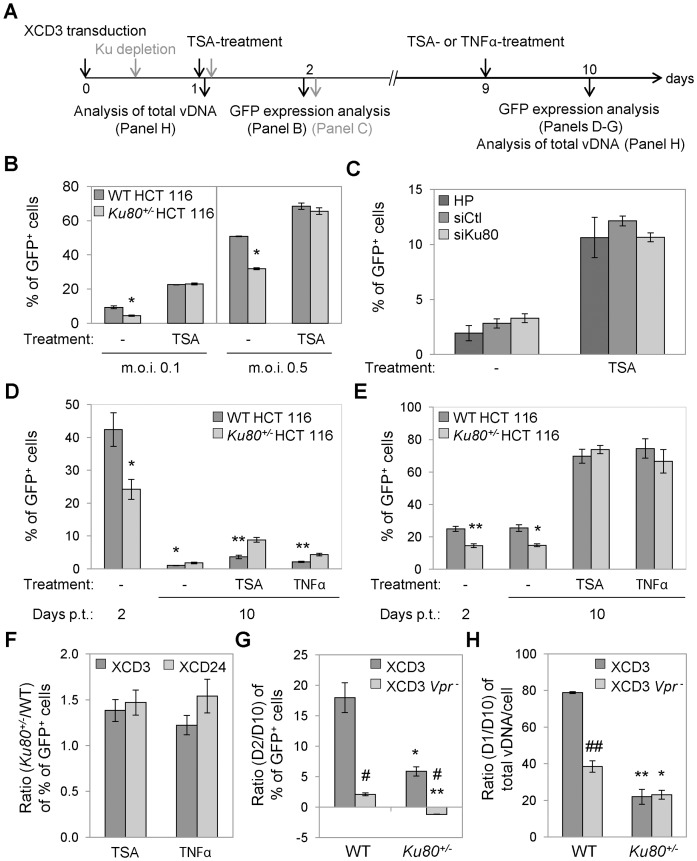
Figure 6. Ku80 haplodepletion increases the level of TNFα- or TSA-induced HIV-1 reactivation.
(A) Schematic representation of the experimental strategy adopted in this figure. (B–D) Wild-type (WT) and Ku80+/− human colon carcinoma HCT 116 cells transduced with XCD3 (at an m.o.i. <0.6) (B,D), and WT HCT 116 cells transfected with an unrelated sequence (siCtl) or with siRNAs directed against Ku80 (siKu80) 8 h after XCD3 transduction (C), were incubated for 24 h in the absence or presence of trichostatin A (TSA) or tumor necrosis factor α (TNFα) either 24 h (B,C), or 9 days upon transduction (B,D). The percentage of green fluorescent protein-positive (GFP+) cells was then estimated by flow cytometry. In panel (C), HP (Hiperfect®) corresponds to cells transfected only with the same amount of liposomes used for siRNA transfection. In panel (B), the results of two independent experimentations performed in duplicate are reported (mean ± SD, n = 4). *, p<0.05, as compared to WT cells. Panels (C,D) show results from 2 and 4 independent experiments, respectively (mean ± SEM). *, p<0.05; **, p<0.01, as compared to WT cells. (E) WT and Ku80+/− HCT 116 cells transduced with XCD24 were treated 9 days later with TSA or TNFα as described in (D) (mean ± SEM, n = 3). *, p<0.05; **, p<0.01, as compared to WT cells. (F) Ratio between the percentage of GFP+ cells of Ku80+/− and WT cells in the presence or absence of TSA or TNFα, as determined in (D) and (E) for the depicted lentiviral (LV) vectors (mean ± SD, n = 3). (G) Ratio between the percentage of GFP+ cells observed upon 2 or 10 days from transduction, as determined in (D) for XCD3 and in (Figure S7A) for XCD3 vpr- on WT and Ku80+/− cells (mean ± SEM, n = 2). *, p<0.05; **, p<0.01, as compared to WT cells; #, p<0.05, as compared to XCD3-transduced cells. (H) Ratio between the quantity of viral DNA (vDNA) 1 or 10 days upon transduction, as determined in (D) for XCD3 and (Figure S7C) for XCD3 vpr-, on WT and Ku80+/− cells (mean ± SEM, n = 2). *, p<0.05; **, p<0.01, as compared to WT cells; ##, p<0.01, as compared to XCD3-transduced cells. p.t., post-transduction.

