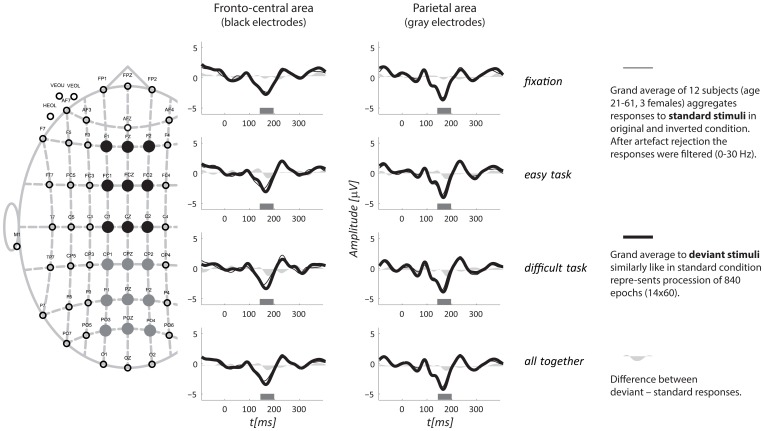
Figure 2.
Grand average ERPs for all three tasks aggregated from two regions. A schematic layout of the recording electrodes with indication of the fronto-central (full black circles) and the parietal (full gray circles) regions of interest is in the left portion of the figure. The top three rows display responses from the three tasks separately, and the fourth row shows all tasks together. The interval of interest, for which the mean amplitude was evaluated, is depicted as a gray rectangle along horizontal axis.

