
Figure 3.
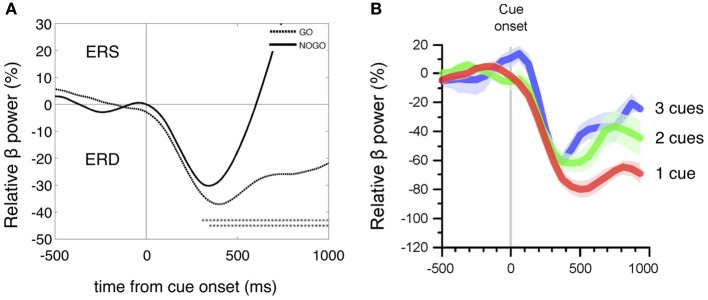
(A) Details of the grand average beta power time courses (ERD/ERS) of 16 subjects within the first second after cue onset for MIgo (dashed line) and MInogo (continuous line). Beta power was compared between MI go and MInogo (bootstrap, one asterisk p < 0.05, two asterisks p < 0.01) and revealed significant differences starting at 250 ms after cue onset. (B) Time courses of relative beta power changes after a visually instructed reaching task with one, two, or three possible target directions (with permission modified from Tzagarakis et al., 2010). Note the similar early beta ERD with a maximal magnitude at ~400 ms in EEG (A) and MEG (B) recordings during different motor tasks.