
Figure 4.
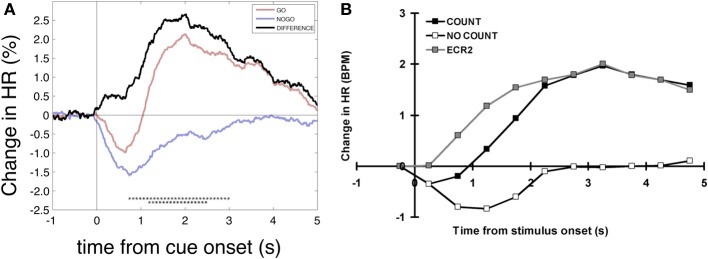
Heart rate changes after go and nogo cues. (A) Grand average time courses of percentage HR changes aligned to cue onset referenced to an interval 1–0 s prior to cue onset (different from the text and analyses above). Displayed are the HR responses for MIgo, MInogo and their difference (hypothetical HR acceleration). Significant differences between conditions are marked with black asterisks (bootstrap, one asterisk p < 0.05, two asterisks p < 0.01). (B) Grand average HR response for silent counting of tones (COUNT) vs. no-count (NO COUNT) and hypothetical HR response (DIFFERENCE). Modified from Lawrence and Barry (2010).