
Figure 5.
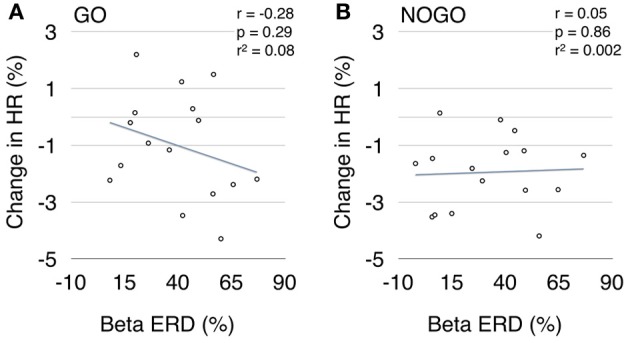
Scatter plot between early beta ERD (%) and brisk HR decrease (%) during motor imagery (A) and withholding of motor imagery (B).
Official websites use .gov
A
.gov website belongs to an official
government organization in the United States.
Secure .gov websites use HTTPS
A lock (
) or https:// means you've safely
connected to the .gov website. Share sensitive
information only on official, secure websites.
Scatter plot between early beta ERD (%) and brisk HR decrease (%) during motor imagery (A) and withholding of motor imagery (B).