Fig. 5.
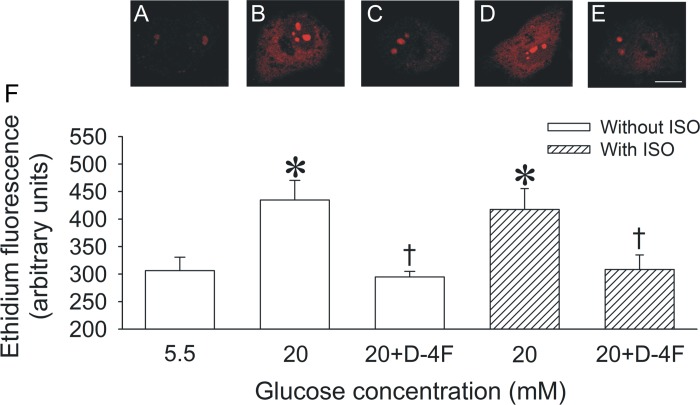
O2·− formation measured with dihydroethidium, which, upon oxidation, yields red fluorescent ethidium in living HCAECs cultured in normal (5.5 mM) or high glucose (20 mM) media. Scale bar = 10 μm. Confocal images of ethidium fluorescence are shown for the following groups: 5.5 mM glucose CON (A), 20 mM glucose (B), 20 mM glucose + D-4F (C), 20 mM glucose + ISO (D), and 20 mM glucose + D-4F + ISO (E). F: quantification of ethidium fluorescence in HCAECs. Data are means ± SE; n = 6 experiments/group. *P < 0.05 compared with the 5.5 mM CON group; †P < 0.05 compared with the 20 mM glucose group.

