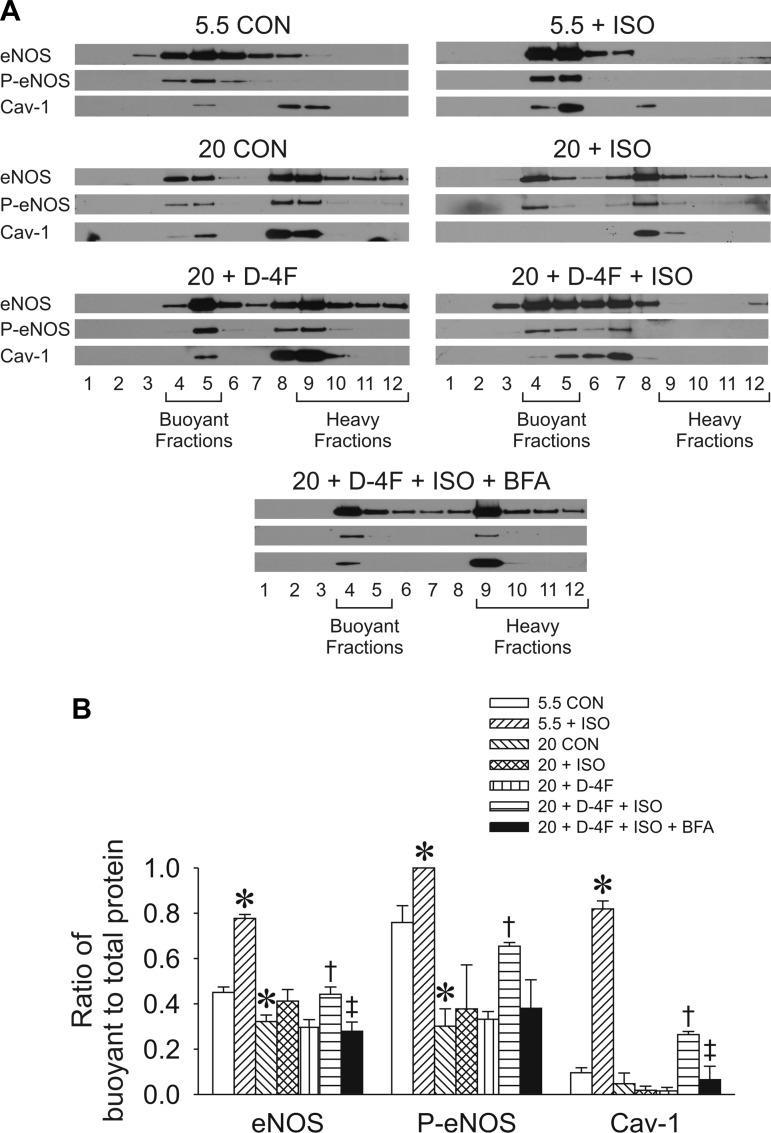
Fig. 7.
Subcellular localization of eNOS, p-eNOS, and Cav-1 in HCAECs evaluated by discontinuous sucrose gradient fractionation. Fractions 4 and 5 represent buoyant caveolar microdomains, whereas fractions 9–12 represent heavy membrane fractions. A: representative sucrose density gradient separations by Western blot analysis. B: quantification of the ratio of buoyant to total protein expression in HCAECs. Data are means ± SE; n = 3 experiments with 5 dishes/group. *P < 0.05 compared with the 5.5 mM glucose CON group; †P < 0.05 compared with the 20 mM glucose group; ‡P < 0.05, 20 mM glucose + D-4F + ISO + BFA group compared with 20 mM + D-4F + ISO group.

