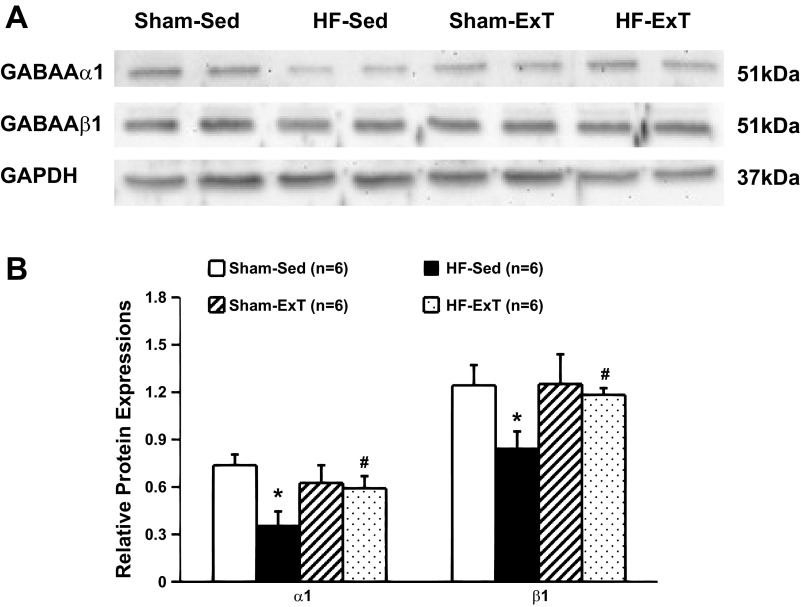
Fig. 5.
A: example of visualized bands of GABAA-α1 and GABAA-β1 receptor and GAPDH in the PVN in the four groups of rats (sham-Sed, HF-Sed, sham-ExT and HF-ExT). B: mean data of band densities normalized by GAPDH in the four groups of rats (sham-Sed, HF-Sed, sham-ExT and HF-ExT). *P < 0.05 vs. the sham group; #P < 0.05 vs. the Sed group.

