
Figure 1.
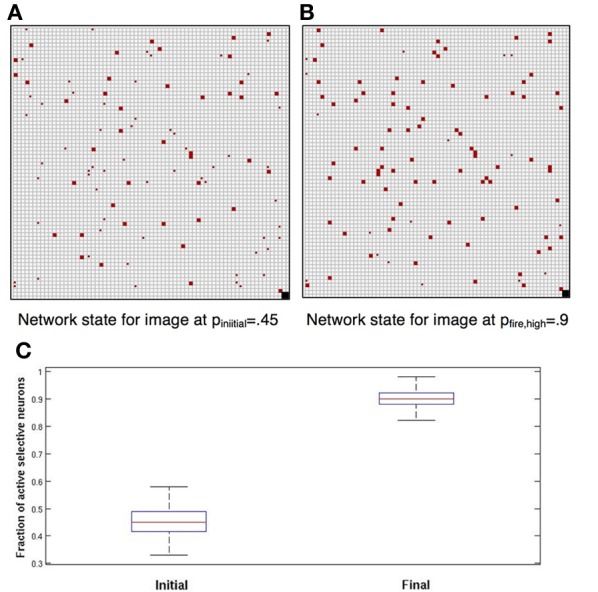
Completion. Each square corresponds to a neuron. Blank squares are inactive non-selective neurons. Grid arrangement is just for presentation—network has no topological structure. (A) In red the selective neurons of the image. Full squares—active. Small dots—inactive. Initially approximately 45% are active; we set pinitial = 0.45. (B) Completion: after network dynamics with pfire, high = 0.9, approximately 90% of selective neurons are active. (C) Box plots showing, for 100 simulations, the distribution of the fraction of active selective neurons, immediately following initial presentation and after completion by network dynamics (red line: median; top and bottom of box: upper and lower quartiles; horizontal lines: quartiles ± 1.5 interquartile range).