Figure 3.

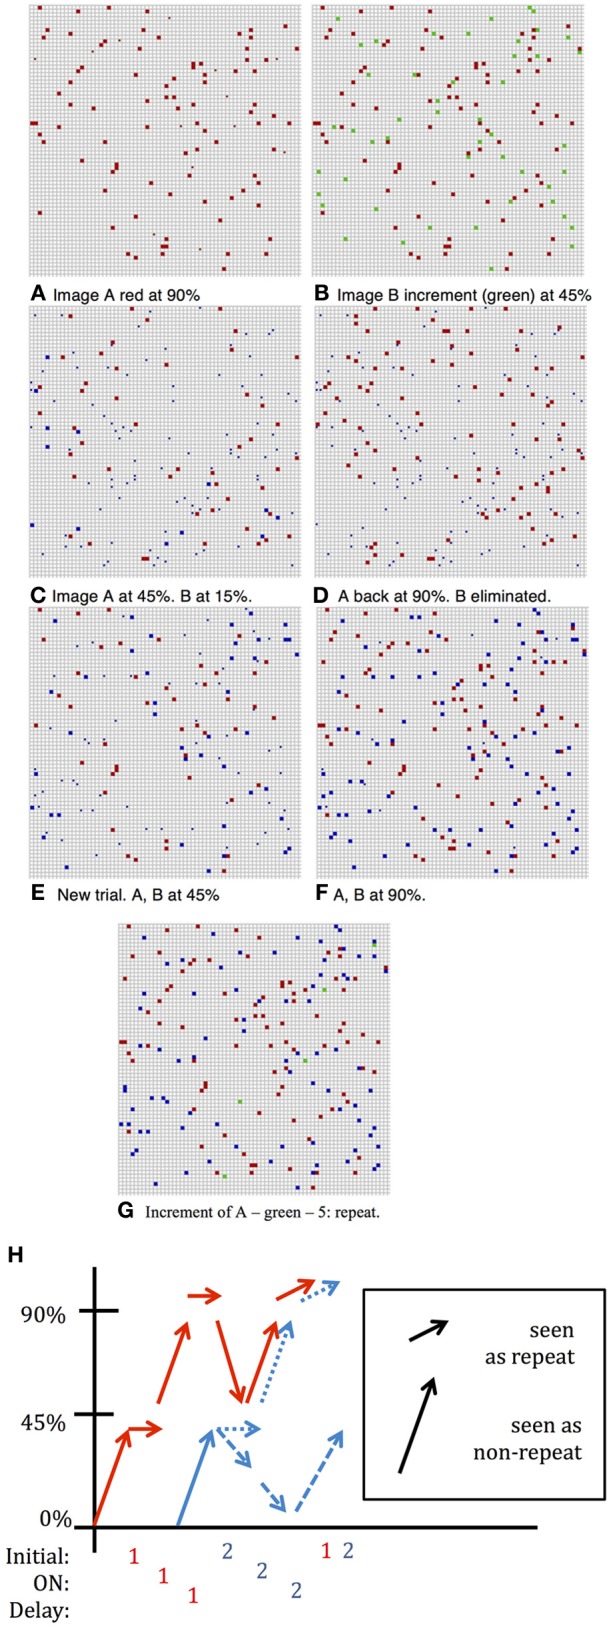
DMS Simulation. Full squares—active selective units, small dots inactive selective units; color indicates neuron's preferred image; fN ~ 100. (A) Situation following presentation of first image and several iterations for completion by network dynamics with pfire,high = 0.9. (B) Second image added with pinitial = 0.45, the noise level of the incoming stimulus. First image (red) still sustained at low noise level: pfire,high = 0.9. Increment in green units is large, ~ 45—response is: no repetition seen. (C) After a few iterations at higher noise level: pfire = 0.45, first image (red) sustained at 45% and second image (blue) sustained at about 15% and will die out (D) following inter-trial iterations, only first image completes to 90%. (E) New Trial. After presentation of second image (and despite first image having completed to 90%) and after a few iterations at pfire = 0.45, first image (red) and second image (blue) sustained at about 45%—both survive (F) Completion of both images to 90% level. Had second image been presented the increment would be small and a repeat flagged. (G) First image presented again to network. Increment (shown in green)—5 units: repeat detected. (H) Summary of activity for different stimulations described above.
