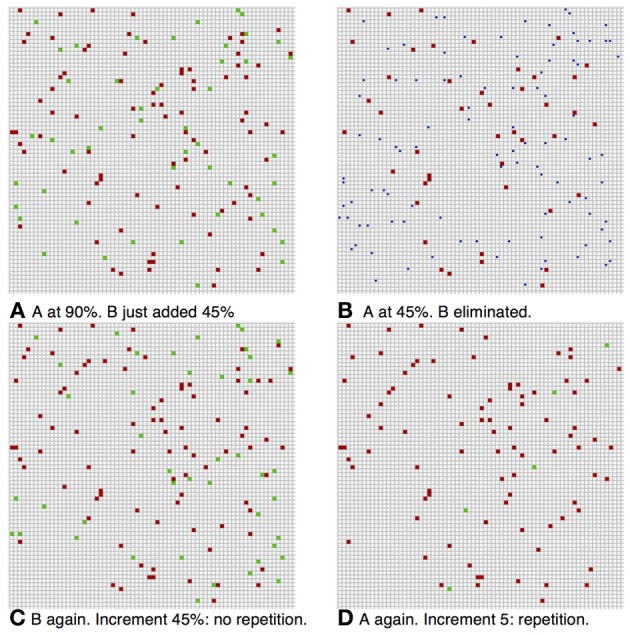
Figure 5.

ABBA simulation. Same parameters as Figure 3 with inhibition increase (A) Image B added at pinitial = 0.45, first image (red) still at 90%. Increment in green ~45%—no repeat. (B) After iterations at pfire = 0.45, ηinhib,high = 0.34, image A (red) at ~45% activity, image B died out. (C) Image A completed to 90% level, image B repeated (BB) increment in green ~45%—no repeat. (D) Second presentation of image B dies out, image A completes to 90%, and after repeat of image A—small increment of 5 units (green)—repeat.
