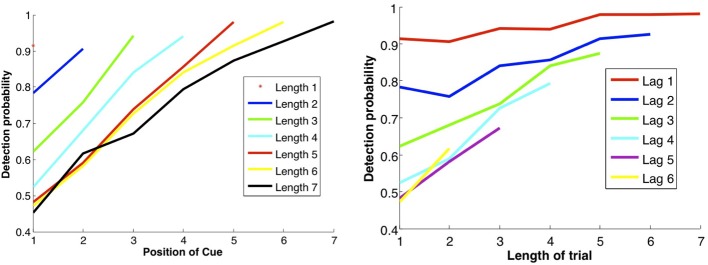
Figure 7.

DMMS performance. Left panel: each curve corresponds to a trial of different length, i.e., number of samples before the match, as shown in the legend. Success rates as a function of the location of the sample in the trial: the later the sample position and the shorter the trial length, the shorter the lag between sample and repeat, and the less time for the attractor to dissipate, so the better the performance. Right panel: each curve corresponds to a fixed lag between sample and repeat, as a function of trial length. Unexpectedly, the longer the trial, the better the performance, perhaps due to growing expectation—and vigilance—for a match, modeled by gradually decreasing inhibition. Note that the data points in the two panels are the same; they are just connected differently to produce different curves.
