
Figure 9.
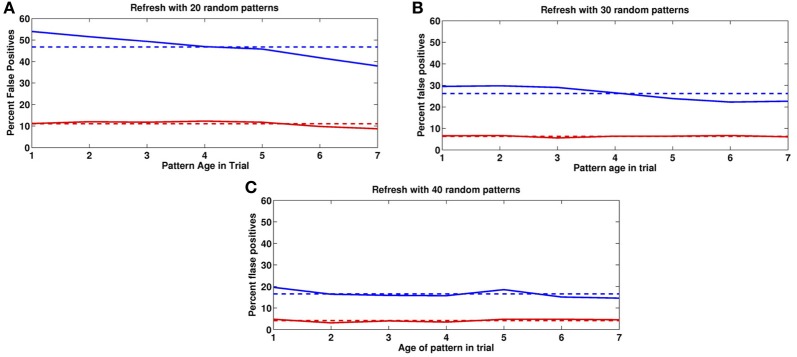
False positives for novel images. False positive rates as a function of age in past trials. Blue: previous trial. Red: two trials back. Horizontal lines correspond to means. (A) 20, (B) 30, (C) 40 random image presentations in the Inter-trial period.