Figure 6.
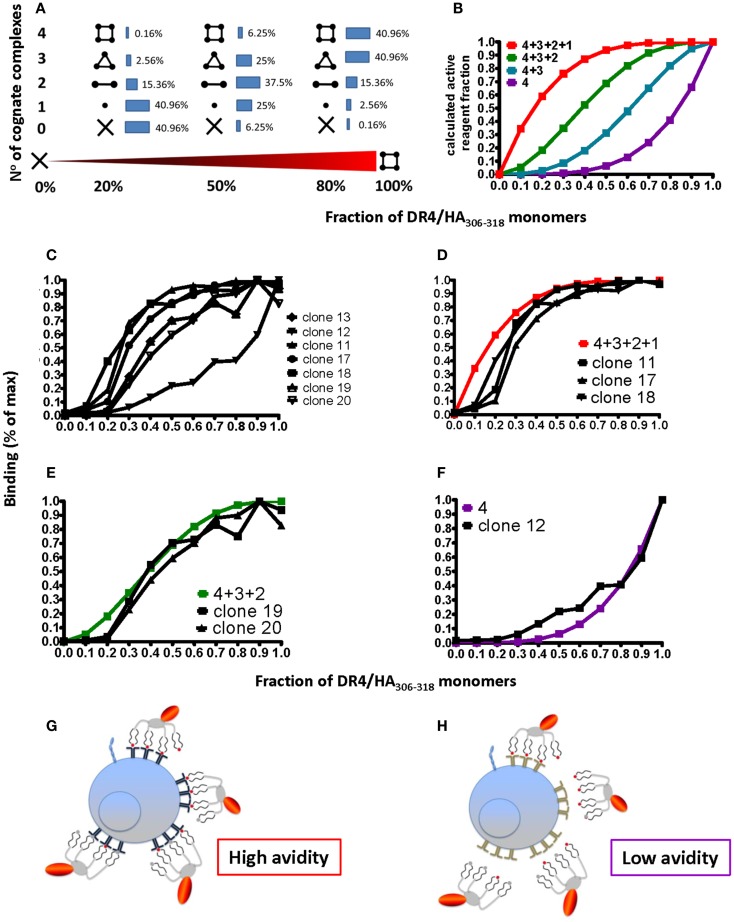
Degree of peptide loading determines the avidity detection threshold on pMHC II multimer detection. (A,B) Cognate (DR4/HA306–318) and irrelevant (DR4/CLIP) pMHC II monomers were mixed in different ratios (x-axis; fractions of one) and reacted with streptavidin–PE to make tetramers. For 0, 20, 50, 80, and 100% of cognate monomers the compositions of tetramers containing X = 0, 1, 2, 3, or 4 cognate monomers were calculated according to the binominal distribution and expressed in %, indicated by the inserted numbers (A), with 100% being the sum of each row; alternatively it was plotted on the y-axis as fraction of 1 against the fraction of cognate/non-cognate complexes (x-axis) for the indicated four avidity levels T cell binding (red: all four complexes bind; green: three; blue: two; and purple: one). (C) Seven DR4/HA306–318-specific CD4+ T cell clones were incubated with 18.5 nM DR4 tetramers with DR4 tetramers containing the indicated factions of HA306–318 and CLIP peptides (x-axis; fraction of one) for 1 h at 37°C and cell-associated fluorescence assessed by flow cytometry and expressed in % of maximal binding (y-axis). (D–F) From these binding isotherms those observed on the clones 11, 17, and 18 match the high avidity binding curve (in red) (D), those recorded on the clones 19 and 20, match the green curve (E) and the one measured on the clone 12 the purple curve (F). (G,H) The cartoon representation of high (G) and low avidity (H) CD4+ T cells as defined by their ability to bind mixed tetramers.

