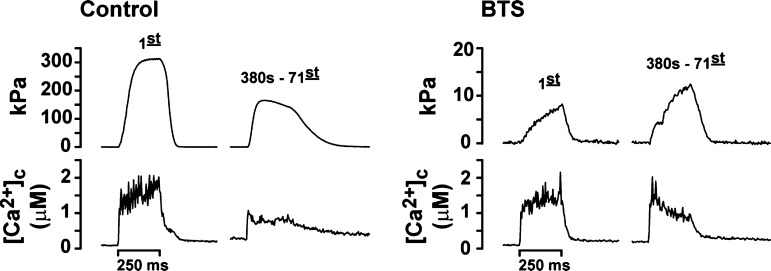
Fig. 1.
Representative trace recordings for isometric tension (top) and [Ca2+]c (bottom) from an intact fiber evoked by a 70-Hz stimulation. Note scale differences. The first contraction and the contraction after 380 s of repetitive stimulations are shown before (control) and after benzyl-p-toluene sulfonamide treatment (BTS). For this particular fiber, after 380 s, tension had decreased 50% from the initial contraction under control conditions. Bar indicates the period of electrical stimulation.

